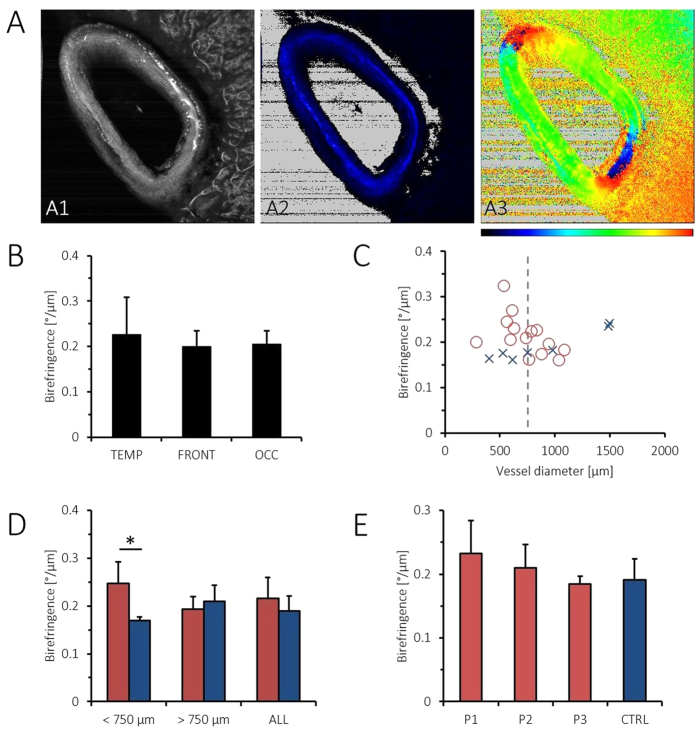
Figure 6. PS-OCM imaging of cortical and meningeal vessel walls in CAA.
(A) PS-OCM z-projection images (1.8 mm × 1.8 mm). The reflectivity image (A1) shows backscatter contrast of a vessel in vicinity of the cortex. Birefringence in the vessel wall can be observed in the retardation image (A2). The varying orientation of birefringent fibers in the vessel wall is well visible in the axis orientation image (A3). Color maps range from 0° to 90° in (A2) and from −90° to +90° in (A3). (B) Pooled data of vessel wall birefringence in the temporal (TEMP), frontal (FRONT) and occipital lobe (OCC), respectively, do not show significant differences. (C) Plot of average vessel wall birefringence vs. vessel diameter. Data from CAA brains is shown as red circles, while control data (CTRL) is shown as blue crosses. (D) Birefringence of vessel walls in CAA brains vs. controls. The statistically significant difference of p < 0.01 is indicated by an asterisk. (E) Birefringence of vessel walls in individual CAA patients vs. controls.

