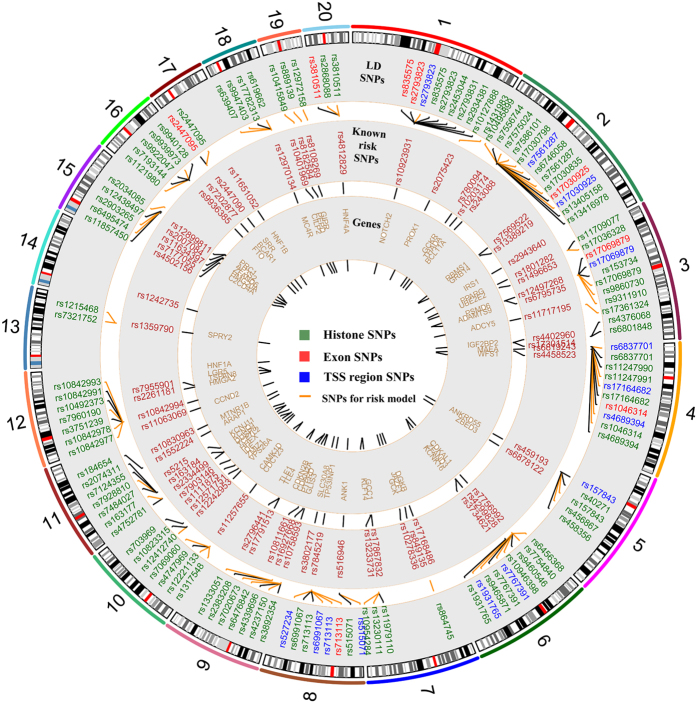
Figure 3. Genome-wide summary of functional annotations of 65 risk SNPs.
Detailed map of the locations and annotations associated with risk for type 2 diabetes throughout the human genome. From central circle to outside, each gives the names of proximal genes, tag- or risk- SNPs, correlated SNPs in high LD with risk SNPs. Correlated SNPs pointed by orange short lines are putative risk SNPs through functional annotations.

