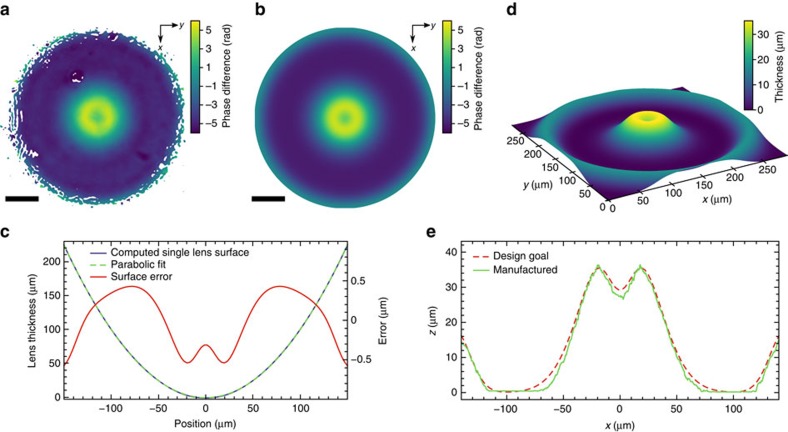
Figure 2. Initial lens characterization and phase plate design.
(a) Measured wavefront deformation at the lens exit compared to a spherical wave. (b) Phase error of a modelled lens stack at the lens exit. Scale bars in a,b correspond to 50 μm. (c) Deformation of every lens surface in the modelled stack of 20 beryllium compound refractive lenses used to generate b. The surface error (solid red line) is enhanced by the axis on the right side. (d) Model of the SiO2 phase plate to correct for errors shown in a–c. (e) Surface profile of the manufactured corrective SiO2 phase plate using ultrashort-pulse laser ablation compared with the design goal d as measured by a laser scanning microscope.

