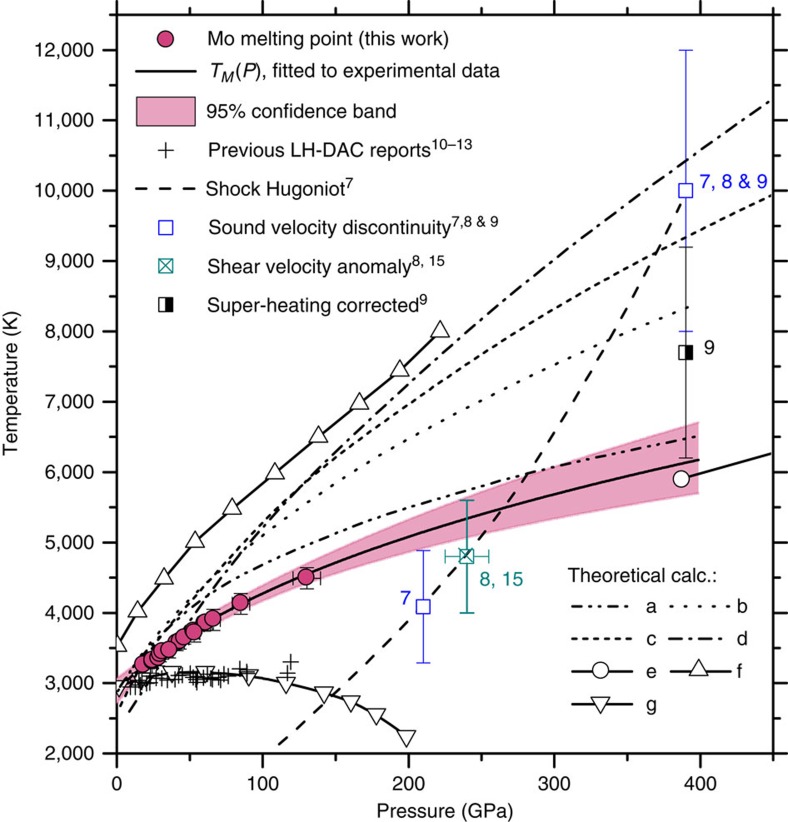
Figure 5. The melting curve of molybdenum under compression.
Red filled circles—melting points obtained in this work by using the quenched microstructure criteria. The pressure error bars represent the range between the cold pressure and the EOS corrected pressure (see ‘Thermal pressure' in Methods); the temperature error bar estimates the spectroradiometry measurement uncertainty16. Previous LH DAC results10,11,12,13 show an essentially flat melting curve. Open squares—sound velocity discontinuities from shockwave studies7,8 measured along the calculated Hugoniot7,8,9 (long dash). Crossed square—shear bulk modulus anomaly8,15. Theoretically calculated melting curves and phase transitions: a—Belonoshko et al.3; b—Cazorla, et al.4; c—calc. melting from bcc phase, Belonoshko et al.2, d—calc. melting from fcc phase, Belonoshko et al.2; e—calc. BCC-FCC boundary, Belonoshko et al.2 and Zeng et al.6; f—Moriarty5; g—d-band-mediated melting, Ross et al.14

