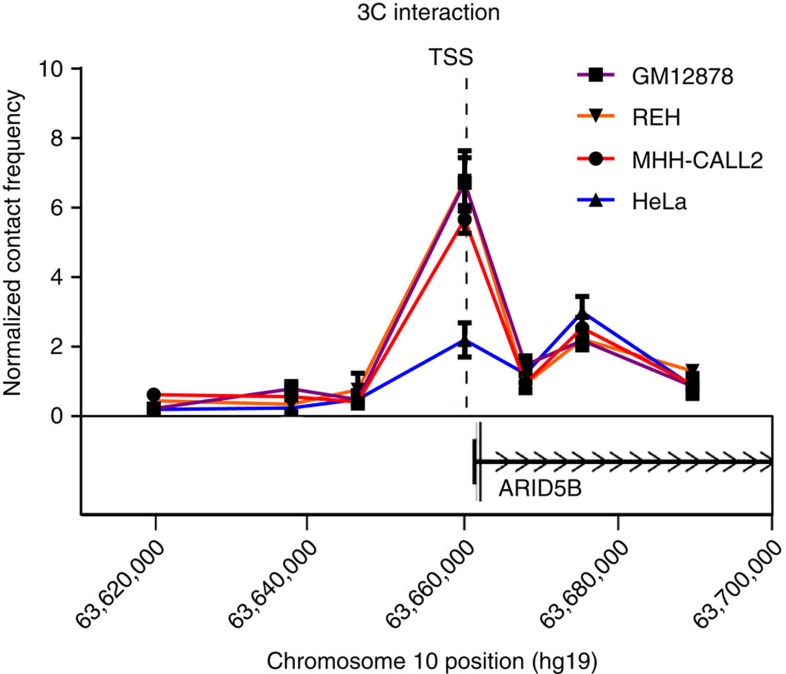
Figure 5. 3C interaction plot of rs7090445 with the ARID5B promoter.
Physical map of 10q21 showing the relative interaction frequencies calculated from the abundance of ligation products formed between the constant fragment, containing rs7090445, and each of the target fragments (ARID5B promoter fragment or surrounding genomic intervals). Data shows mean qPCR abundance ±s.e.m., normalized to the abundance of inter-site control region. The assay was performed independently four times for GM12878, REH and HeLa, and three times for MHH-CALL2. GM12878, MHH-CALL2 and REH show a significant increase in the contact frequency between rs7090445 and ARID5B TSS compared to both HeLa and cell specific back ground levels, Students t-test P<0.05 two sided.

