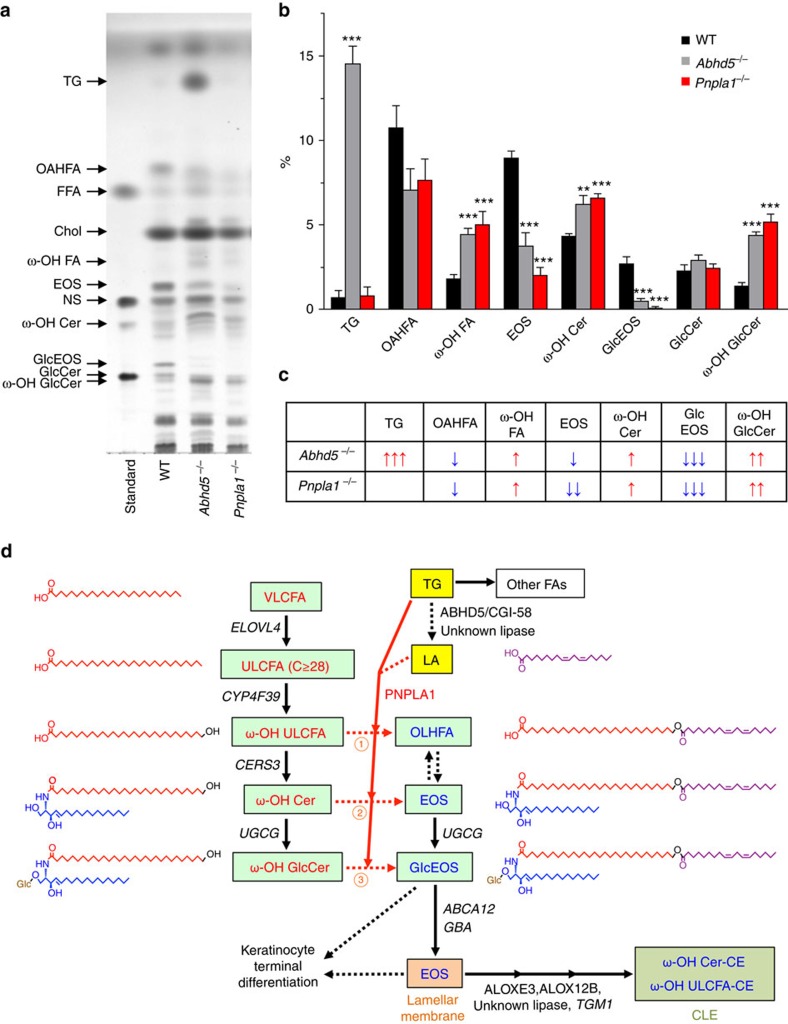
Figure 6. Roles of PNPLA1 and ABHD5 in epidermal ceramide metabolism.
(a) Representative TLC analysis of lipids extracted from WT, Abhd5−/−, and Pnpla1−/− epidermis at E18.5. (b) Quantification of panel A by densitometric analysis (mean±s.e.m., n=6, 5 and 5 for WT, Abhd5−/− and Pnpla1−/− mice, respectively; **P<0.01 and ***P<0.001 versus WT mice). Cumulative results of three independent experiments are shown. (c) A summary profile for a,b. Up and down arrows represent an increase and a decrease, respectively, in the level of individual lipids in mutant mice relative to WT mice. The number of arrows indicates the relative degree of difference. (d) Schematic diagram showing the proposed role of PNPLA1 in epidermal ceramide metabolism in association with keratinocyte differentiation and skin barrier function. Significantly increased and decreased lipid metabolites in Pnpla1−/− epidermis are highlighted in red and blue, respectively. Upregulated enzymes are shown in italics. LA derived from TG appears to be esterified at the ω-position of ω-OH ULCFA, ω-OH Cer and/or ω-OH GlcCer (reactions 1, 2 and 3, respectively) by PNPLA1 transacylase. For details, see text.

