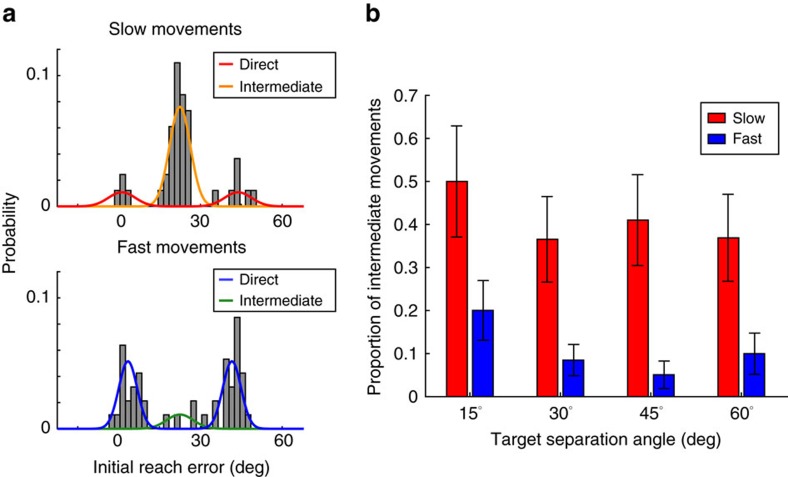
Figure 3. Estimated proportion of intermediate movements.
(a) Example maximum-likelihood fits to the distributions of Fast and Slow movements for a single participant, for a target-separation angle of 45°. Grey histograms indicate the initial-reach-error distribution. Smooth lines indicate direct (bimodal) and intermediate (unimodal) components of the fitted model. (b) Average proportion of intermediate movements (θ) at different movement speeds and target-separation angles across all participants (n=16). Error bars represent s.e.m.

