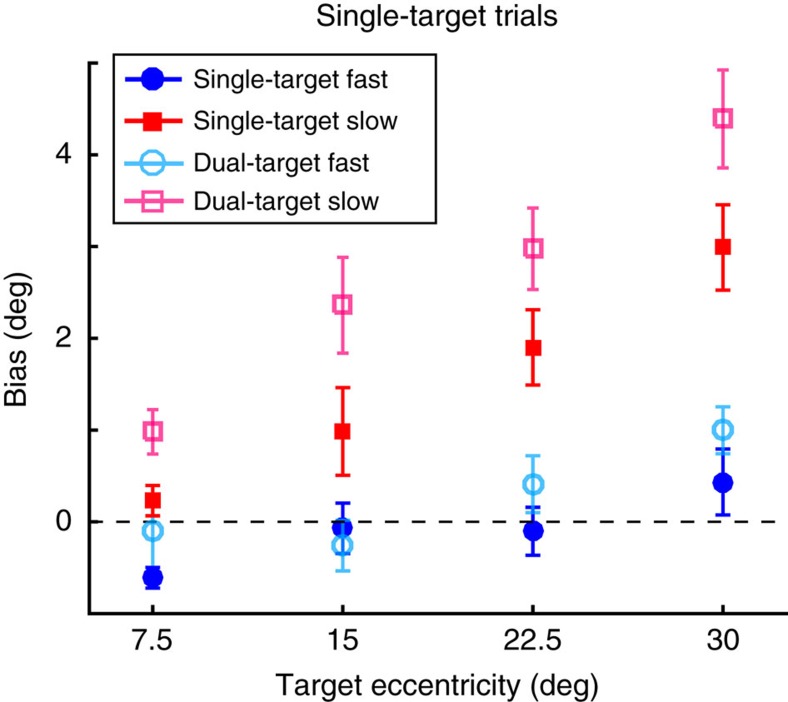
Figure 7. Average inward bias in initial reach direction for Experiment 1 as a function of target eccentricity.
Data were averaged across all participants (n=16) for single-target biases (Slow movements, red; Fast movements, blue) and dual-target biases based on μd from the mixture-model fits (Slow movements, pink; Fast movements, cyan). Positive values indicate direct reaches were biased towards the midline and negative values indicate reaches biased away from the midline; error bars represent s.e.m.

