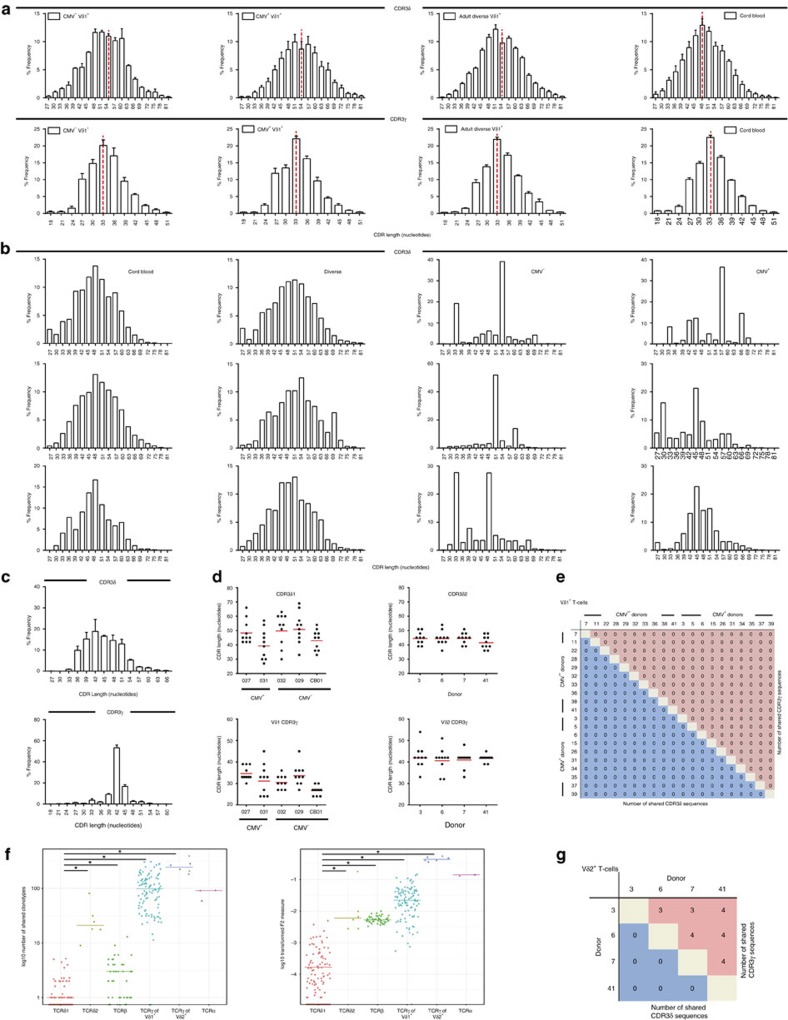
Figure 4. CDR3 length and diversity within the Vδ1 and Vδ2 TCR.
(a) Comparison of the mean ±s.e.m. from frequency-normalized CDR3δ and CDR3γ length spectratyping for Vδ1+ T cells in CMVneg (n=5), CMV+ (n=8), adult diverse (n=7) and cord blood (n=5) donors. (b) Comparison of non-normalized CDR3δ length spectratyping for Vδ1+ T cells from 3 representative individuals from CMV-seronegative (representative of n=5), CMV-seropositive (representative of n=8), adult diverse (representative of n=7) and cord blood (representative of n=5) donor groupings. (c) Non-normalized length spectratyping for CDR3δ and CDR3γ in adult Vδ2+ T cells (n=4). (d) Length distribution and mean (red line) within the top 10 most prevalent clonotypes in CDR3δ (left two panels) and CDR3γ (right two panels) of Vδ1+ T cells (5 donors shown, representative of 20) and Vδ2+ T cells (from 4 donors). (e) Publicity in the 10 most prevalent clonotypes for each donor's Vδ1+ TCR repertoire compared against all other donors (both aa and nt sequences compared). (f) Comparison of relative publicity in TCR repertoires. Overlap of individual TCR repertoires in TCRδ1 (n=15), TCRδ2 (n=4), TCRβ (n=15, ref PMID: 27183615), TCRγ of Vδ1+ cells, TCRγ of Vδ2+ cells and TCRα (n=3). Each dot shows relative similarity of repertoires for a pair of unrelated donors in terms of the shared TCR variants with identical amino acid CDR3 sequence, and V and J segments used. Overlap was estimated either as a number of clonotypes shared between the sets of top-1,000 largest clonotypes of each repertoire (left), or as a sum of clonotype frequencies shared between the total repertoires (F2 metrics of VDJTools software, right). (g) Publicity in the 10 most prevalent clonotypes for each donor's Vδ2+ TCR repertoire compared against all other donors (both aa and nt sequences compared). Mean overlap of sequences between each group was analysed by Kruskal–Wallis ANOVA with Dunn's post-test comparisons *P<0.003.

