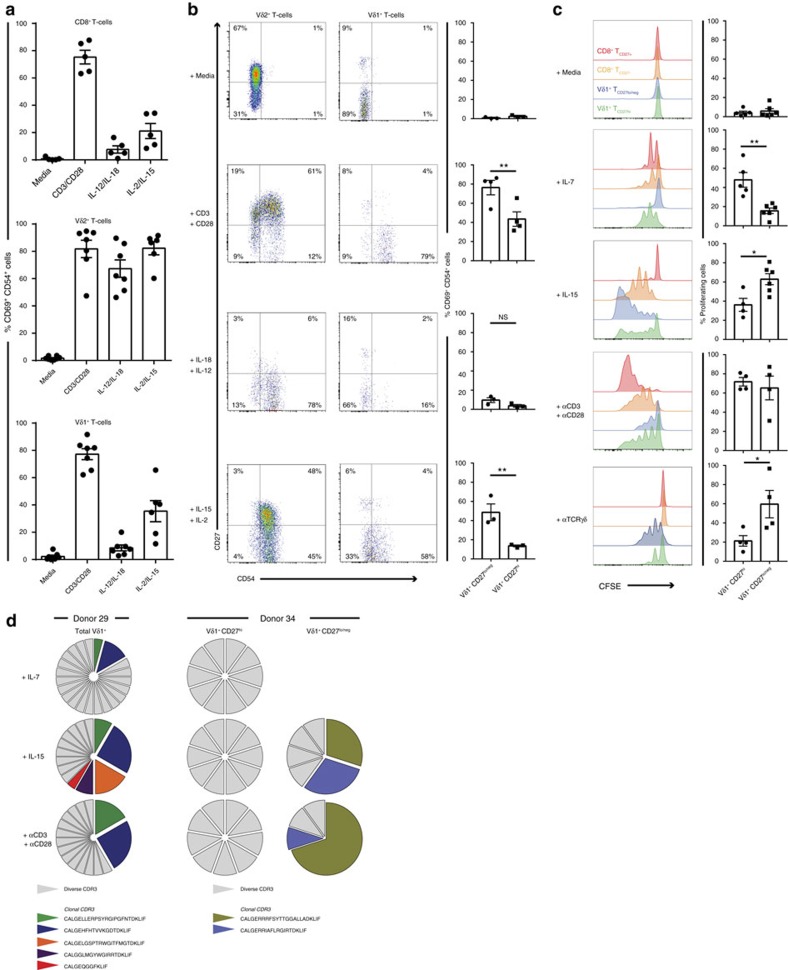
Figure 6. Functional characteristics of clonally expanded CD27lo/negversus naive CD27hi Vδ1+ T cells.
(a) Sorted CD3+ T cells were incubated for 72 h with cytokines or anti-CD3/CD28 beads. CD8+, Vδ2+ and Vδ1+ T cells were then assessed for the upregulation of CD69 and CD54. Graphs show mean ±s.e.m. from medium controls (n=5–7), CD3/CD28 (n=5–7), IL-12/IL-18 (n=5–7) and IL-2/IL-15 (n=5–6) stimulation. (b) Flow cytometry analysis of Vδ2 and Vδ1 T cells from a, with cells analysed for CD27 and CD54 expression (left, representative flow cytometry plots) and graphs show mean±s.e.m. of CD69+ CD54+ cells in Vδ1+ CD27hi and Vδ1+ CD27lo/neg populations, data from medium controls (n=4), CD3/CD28 (n=4), IL-12/IL-18 (n=3) and IL-2/IL-15 (n=3). (c) Proliferation of Vδ1 T cells, assessed by CFSE dilution, for 7 days in response to stimulation with IL-7, IL-15, anti-CD3/CD28 and anti-TCRγδ mAb. Histograms are from a representative focused adult donor's Vδ1+ CD27hi cells, Vδ1+ CD27lo/neg cells, CD8+CD27+ or CD8+ CD27neg T cells and graphs show mean±s.e.m. of proliferating cells (n=4–6). (d) Total proliferating Vδ1+ T cells (Left, donor 29) or CD27hi and CD27lo/neg Vδ1+ T cells were single cell sorted and CDR3δ sequenced by PCR, prevalent clonotypes detected by previous deep sequencing are coloured and diverse individual sequences are grey. Donor 29 had 24 single cells, and donor 34 had 10 single cells analysed from each condition. Data analysed by student's t test, NS=P>0.05, *P<0.05 and **P<0.01.

