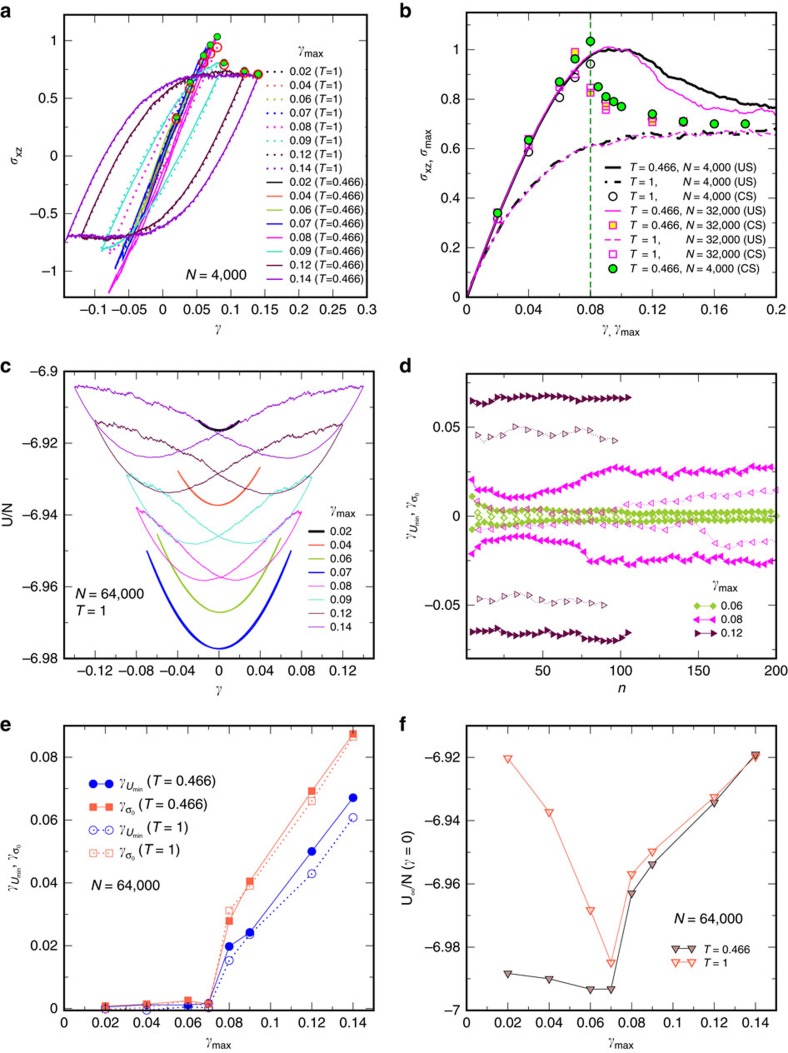
Figure 1. Stress and energy across the yielding transition.
(a) Stress–strain plots of the two differently annealed glasses for various strain amplitudes in the steady states of oscillatory shear deformation. Maximum stress in the cycle for each amplitude is marked by filled and open circles for T=0.466 and T=1, respectively. (b) Averaged stress–strain curves for uniform strain (US) are shown as lines—thick (black) for N=4,000 and thin (magenta) for N=32,000 while solid and dashed lines represent T=0.466 and T=1, respectively. Maximum stress σmax versus γmax are shown for cyclic strain (CS) (circle and square denote N=4,000 and 32,000, respectively, with filled and open symbols corresponding to glasses from T=0.466 and T=1). The vertical line at γmax=0.08 indicates the sharp yielding transition seen. (c) Energy versus strain in the steady states, displaying a bifurcation in the strain corresponding to minima in energy at the yielding transition between γmax=0.07 and 0.08. (d) Strain values corresponding to energy minima (γUmin) and and zero stress  are shown as open and filled symbols respectively, versus the number of cycles for different γmax. For γmax=0.08 an initial relaxation towards zero is reversed as the system evolves to a yielded steady state with finite γUmin and
  . (e) γUmin and
  as functions of strain amplitude γmax, displaying a transition beyond γmax=0.07. (f) Asymptotic energy per particle at γ=0 versus strain amplitude γmax. Energies decrease with γmax until the yield strain is reached, after which they increase with γmax.

