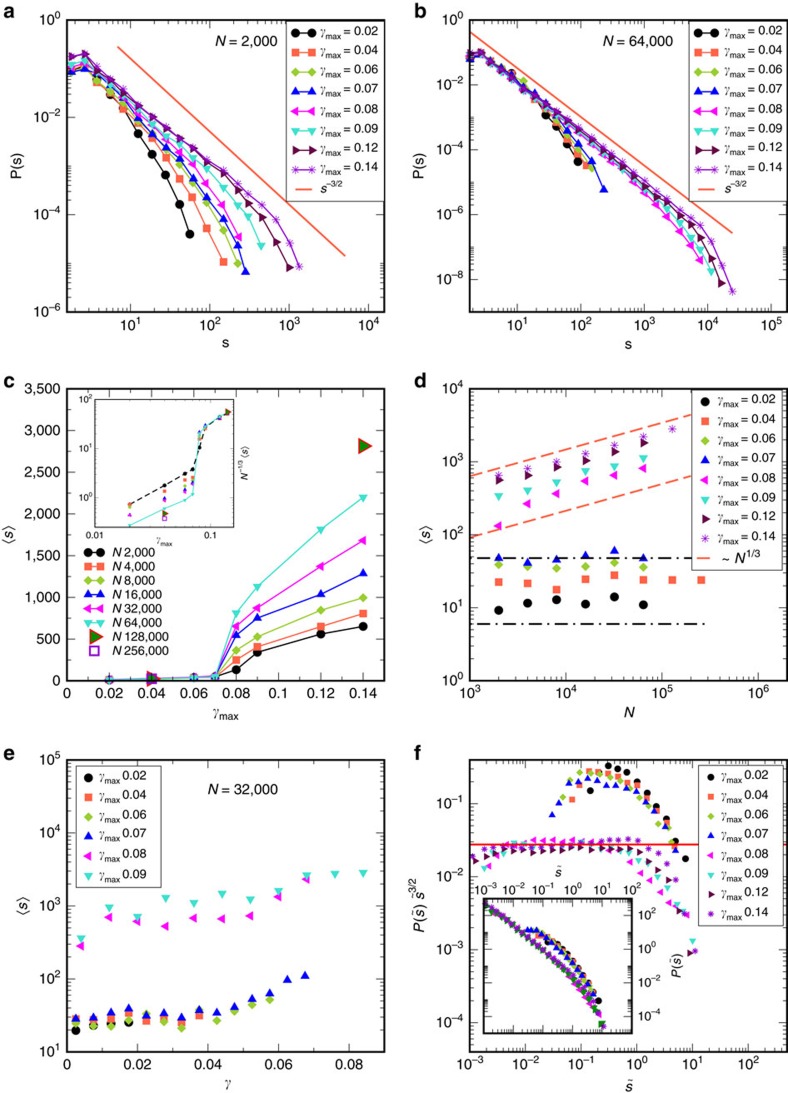
Figure 2. Statistics of avalanches as a function of strain amplitude γmax and system size N.
(a) Cluster size distributions for N=2,000 displaying a power law with a cutoff that grows with γmax but does not indicate sharp changes at yielding. (b) Cluster size distribution for N=64,000 displaying a sharp increase in the cutoff size across the yielding transition. The line in both panels corresponds to a power law with exponent −3/2. (c) Mean cluster size versus γmax showing a qualitative change across the yielding transition, with strong system size dependence above γy. The inset shows the mean cluster size scaled with N1/3, which describes well the size dependence above γy. (d) Mean cluster size versus system size N shows no significant size dependence for γmax<γy but a clear N1/3 dependence above. A crossover in behaviour is seen for γmax=0.08. Lines, with N0 (constant) and N1/3 dependence, are guides to the eye. (e) Mean cluster sizes for bins in strain γ for different γmax for N=32,000. Mean cluster size does not depend on γmax, and depends only mildly on strain γ, for two distinct sets, below and above yield strain γy. (f) Scaled cluster size  distributions exhibit data collapse separately for γmax<γy and γmax>γy (inset). Distributions for γmax<γy do not display a power law regime, whereas γmax>γy do, over about two decades in
  , as highlighted in a plot of
  versus
  . Data shown are for T=1, and averages are over the full cycle, except for (e) which are averaged over the first quadrant.

