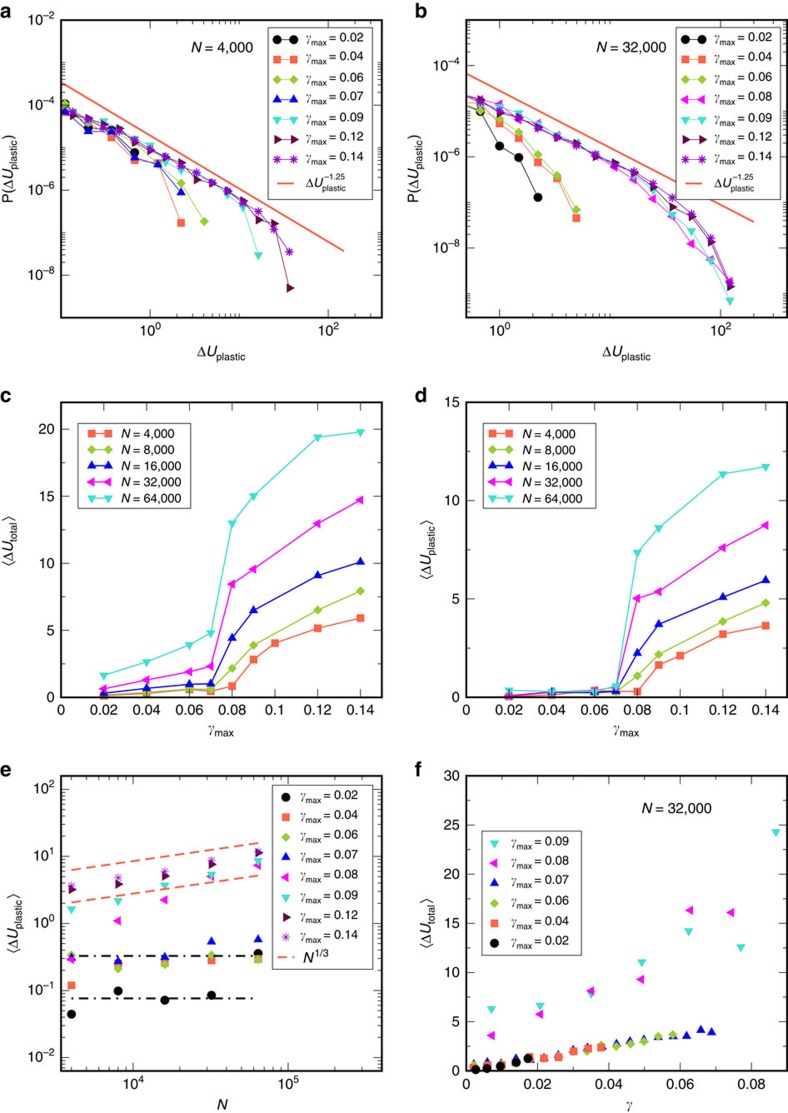
Figure 3. Statistics of energy drops as a function of strain amplitude γmax and system size N.
Distributions of energy drops (a) for N=4,000 show no clear separation of γmax<γy and γmax>γy, whereas (b) for N=32,000 a clear separation is visible. In both cases, a power law regime is apparent, with exponent ∼1.25. (c) Mean energy drops versus γmax, indicating a sharp change at γy. (d) Mean energy drops considering only plastic regions show no system size dependence below γy. (e) Mean energy drop (plastic component) versus system size N shows no significant size dependence for γmax<γy but a clear N1/3 dependence above. A crossover in behaviour is seen for γmax=0.08. Lines, with N0 (constant) and N1/3 dependence, are guides to the eye. (f) Mean energy drops (total) for bins in strain γ for different γmax for N=32,000, T=1 showing no dependence on γmax, and only a mild dependence on strain γ, for two distinct sets, below and above yield strain γy. Data shown are for T=1, and averages are over the first quadrant.

