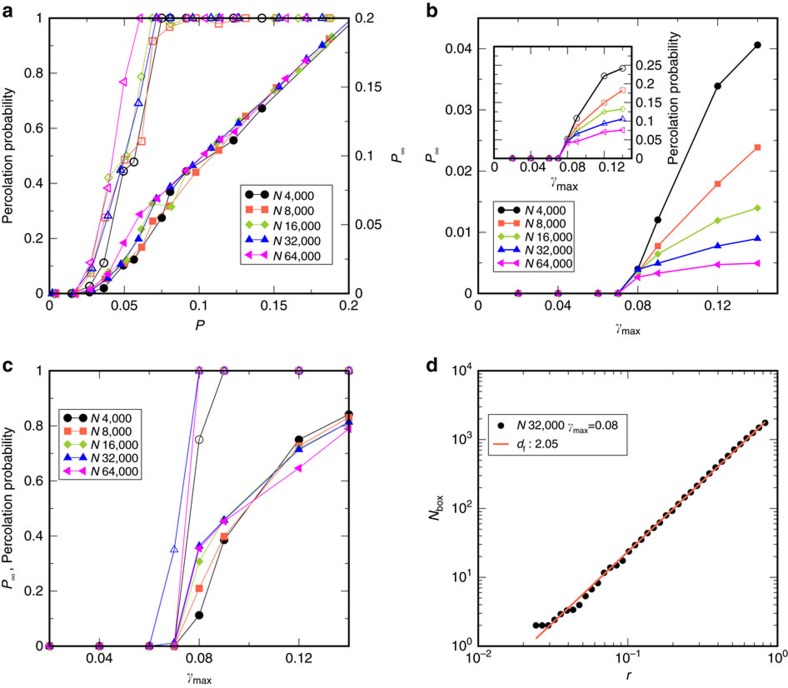
Figure 4. Percolation of avalanches and fractal dimension of percolating clusters.
(a) Percolation probability and weight of the spanning cluster P∞ shown as open and filled symbols, respectively, against the occupation number P for different system sizes, considering all events, for γmax=0.08. A percolation transition takes place for P≃0.05 although the threshold is system size dependent. (b) Percolation probability (inset) and P∞ averaged over all events, versus γmax. (c) Percolation probability and P∞ for the cumulative set of particles rearranging over a cycle, shown as open and filled symbols respectively versus γmax, indicating a percolation transition at the yielding strain γy. P∞ just above the transition increases with system size. (d) Fractal dimension estimation from box counting. A log-log plot of the number of occupied boxes (Nbox) is shown versus the magnification r. The slope results in an estimated fractal dimension df=2.05. Data shown are for T=1, and averages are over the first quadrant.

