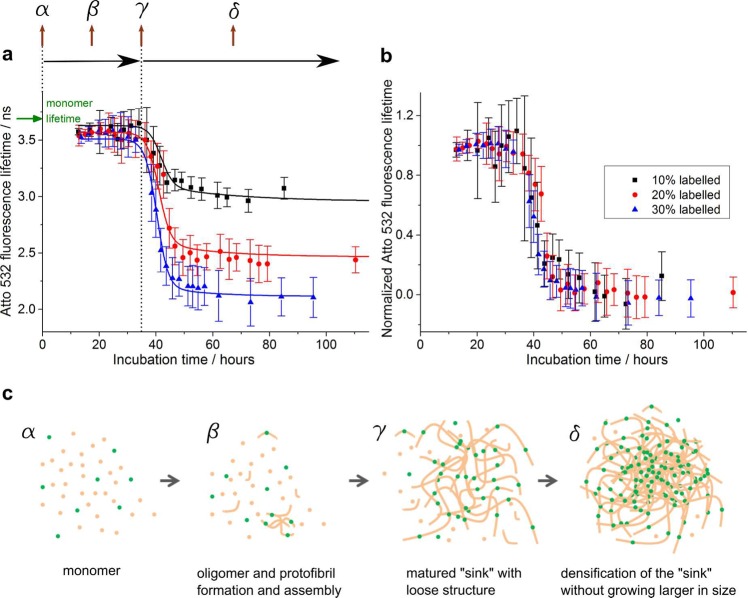
Figure 3.
TCSPC-FLIM measurements of amyloid cluster formation kinetics of K18-Atto532 samples with different dye labeling ratios. (a) Fluorescence lifetimes of K18-Atto532 as a function of aggregation time for samples with 10%, 20%, and 30% labeling ratios. The sigmoidal curves are the fitted lines using the kinetic model described in the main text. (b) Same data represented with normalized fluorescence lifetimes, demonstrating that the cluster formation kinetics are not significantly affected by the presence of the dye labels. (c) Schematic to illustrate the K18 tau aggregation model used for FLIM data fitting. Green, fluorescent dye labels; beige, proteins.

