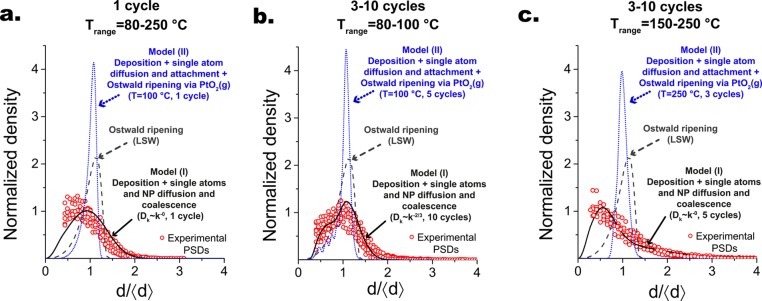
Figure 4.
Experimental and simulated PSDs rescaled with respect to their respective average diameter and then normalized with respect to their integral. The black solid lines are representative PSDs obtained with model (I), the dark gray dashed line is the classical Lifshitz–Slyozov–Wagner (LSW) PSD for diffusion-limited Ostwald ripening, and the blue dotted lines are representative PSDs obtained with model (II). (a) Experimental PSDs obtained after one cycle in the temperature range 80–250 °C; the sum of squared errors (SSE) for model (I), model (II), and the LSW PSD is equal to 3, 131, and 49, respectively. (b) Experimental PSDs obtained in the temperature range 80–100 °C and in the cycle range 3–10; the SSE for model (I), model (II), and the LSW PSD is equal to 9, 182, and 65, respectively. (c) Experimental PSDs obtained in the temperature range 150–250 °C and in the cycle range 3–10;the SSE for model (I), model (II), and the LSW PSD is equal to 3, 157, and 72, respectively.

