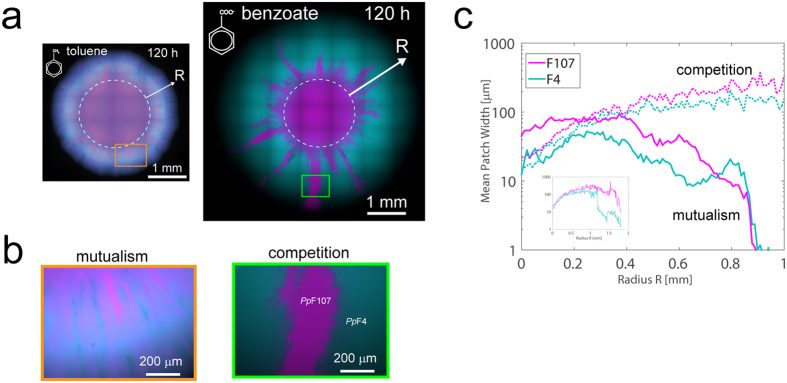
Figure 3. Spatial patterns of consortium as function of trophic interaction on solid media.
(a) Fluorescence overlay images of eGFP-tagged PpF4 and mCherry-tagged PpF107 shown with pseudo-colors cyan and magenta, respectively. Pictures of exemplary colonies are shown after 120 h incubation at room temperature. The only source of carbon and energy was either gaseous toluene (for mutualism) or 10 mM benzoate (for competition). Dashed circle indicates the initial droplet inoculum (0.5 μl droplet with OD600 adjusted to 1.0, corresponding to ≈100,000 cells). (b) Close-up images of sectors of the colony (indicated by orange and green rectangles in a). (c) Analysis of the mean width of PpF4 and PpF107 patches or strands along the growing front line, as a function of radial distance R from inoculation area and of carbon source (benzoate shown in dotted lines, toluene in plain lines, see Methods for calculation details).

