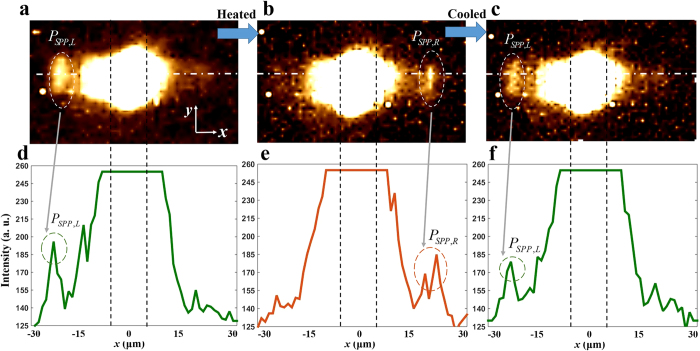
Figure 6.
IR CCD images when the sample is (a) in room temperature, (b) heated up to 90 °C, and (c) cooled down to room temperature. (d–f) Cross-sectional data of far-field intensities according to x-coordinate extracted from (a–c) respectively. The lines where intensity data are extracted are depicted in (a–c) as white dash-dotted lines. The black dashed lines in (a–c) indicate position of the sample along the x-axis.

