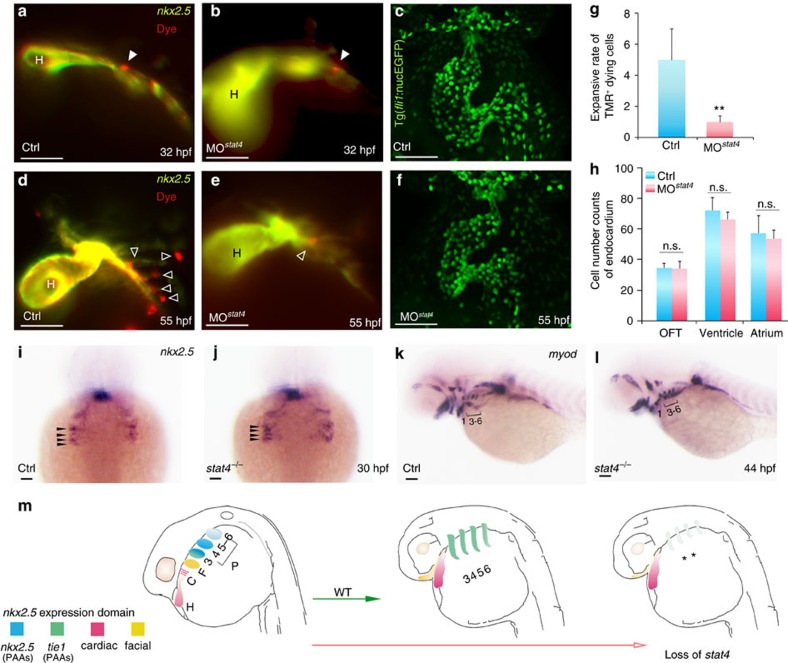
Figure 5. Cell tracing of endothelial precursors.
(a,b,d,e) The control (a,d) and stat4 morphant (b,e) Tg(nkx2.5:ZsYellow) embryos injected with CellTracker Red (white arrowheads) in the non-heart ZsYellow region at 28 hpf are imaged at 32 hpf (a,b) and again at 55 hpf (d,e). The hollow arrowheads indicate the labelled cells. (c,f) Confocal Z-stacks captured fli1+ endothelial cells in the heart region at 55 hpf in the control (c) and stat4 morphants (f), respectively. (g) Quantification of TMR+ cells (n=12 per each group, Error bars indicate the s.d. Kruskal–Wallis test, **P=0.003). (h) Quantification of green endothelial cells at 55 hpf across three experimental replicates (n=6 embryos/replicate in each group. Analysis of variance (ANOVA) test with multiple comparison post-hoc test, P=0.9999 no significant (n.s.) difference in the outflow tract (OFT), P=0.6866 (n.s.) in the ventricle, P=0.9878 (n.s.) in the atrium between the control and stat4 morphants. (i,j) Morphogenesis of the four pairs of nkx2.5+ pharyngeal clusters between the wild-type control and stat4 mutants at 30 hpf (indicated by black arrows). (k,l) The myod transcripts expressing PAAs are visualized in the control and stat4 mutants at 44 hpf. (m) The schematic illustration shows the fate of nkx2.5+ cells in ALPM in wild-type (WT) and loss of stat4 embryos at 28 and 55 hpf. The first pair gives rise to the facial lineage, and 2 to 4 pairs had endothelial fate. ALPM nkx2.5+ clusters (H,C,F, PAAs 3–6). Blue: nkx2.5 expressing cells, Green: tie1 expressing cells, Red: cardiac lineage and Yellow: facial lineage. C: cardiac, F: facial, H: heart. Scale bars, 50 μm. n≥30 embryos per each group in i–l.

