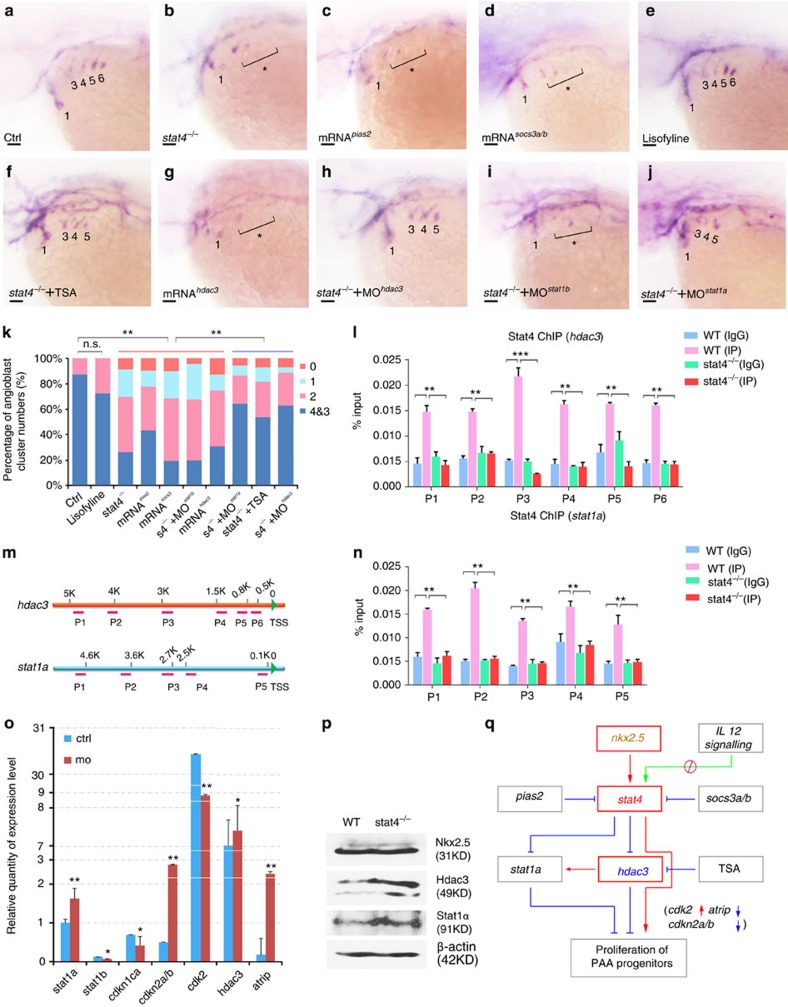
Figure 7. stat4 promoted the PAA angioblast programme by suppressing stat1a and hdac3.
(a–k) In situ hybridization analysis of tie1 transcripts in the control (a), stat4 mutants (b), embryos with 50 ng μl−1 pias2 mRNA injection (c), embryos with 50 ng μl−1 socs3a and socs3b mRNAs injection (d), embryos treated with 85 μM lisofylline (e), stat4 mutants with 0.2 μM TSA treatment (f), embryos with 50 ng μl−1 hdac3 mRNA injection (g), stat4 mutants with 4 ng μl−1 hdac3 morpholino (h), stat4 mutants with 4 ng μl−1 stat1b morpholino (i), stat4 mutants with 4 ng μl−1 stat1a morpholino (j) at 44 hpf. Scale bars, 50 μm. (k) Proportional quantification of indicated tie1+ expressing cords number (s4−/−: stat4 mutants), Kruskal–Wallis test with the Dunn's multiple comparison test, **P<0.01, n.s.: P>0.05, n ≥30 embryos per each group. (l–n) The ChIP analysis with anti-Stat4 antibody for the promoter regions of hdac3 and stat1a in the wild-type control and stat4 mutants at 44 hpf across six experimental replicates (n=30 embryos/replicate in each group, analysis of variance (ANOVA) test with multiple comparison post-hoc test, **P<0.01, ***P<0.001). (m) The binding enrichment regions at the hdac3 and stat1a locus are indicated by primers (P1–P6). (o) Q-PCR results of related genes expression in the control and stat4 morphants at 44 hpf across six experimental replicates (n=10 embryos/replicate in each group. Error bars indicate s.d., unpaired two-tailed Student's t-test, *P<0.05, **P<0.01. (p) Protein levels of Nkx2.5, Hdac3 and Stat1a in the wild-type control and stat4 mutants detected by western blots at 44 hpf. β-actin is used as the internal control. (q) A network is drawn to illustrate the stat4 pathway in controlling PAA proliferation. Red: activation, Blue: suppression.

