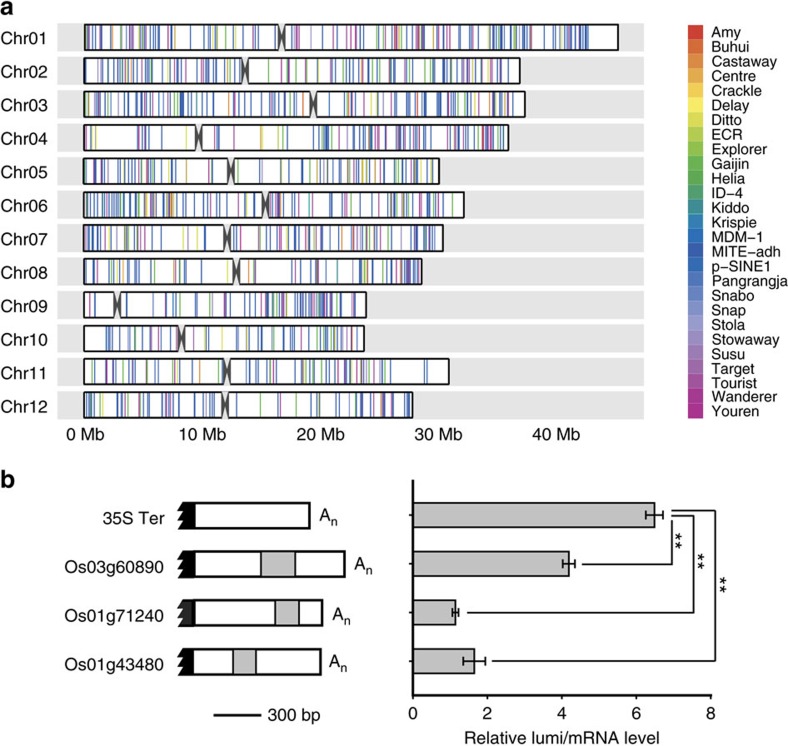
Figure 4. Other MITEs in 3′-UTRs repress translation.
(a) Genomic distribution of 3′ UTR-localized MITEs in the rice genome. A karyogram composed of colored bars is presented; each colored bar represents a MITE in the 3′ UTR of the target gene. Black angles represent centromeres. (b) Genomic organization of three randomly chosen MITEs in 3′-UTRs (left) and their effects on translational repression in rice protoplasts (right). The data represent the means±s.d., n=3. **P<0.01 (Student's t-test). The data indicate relative luminescence/mRNA level based on three independent experiments.

