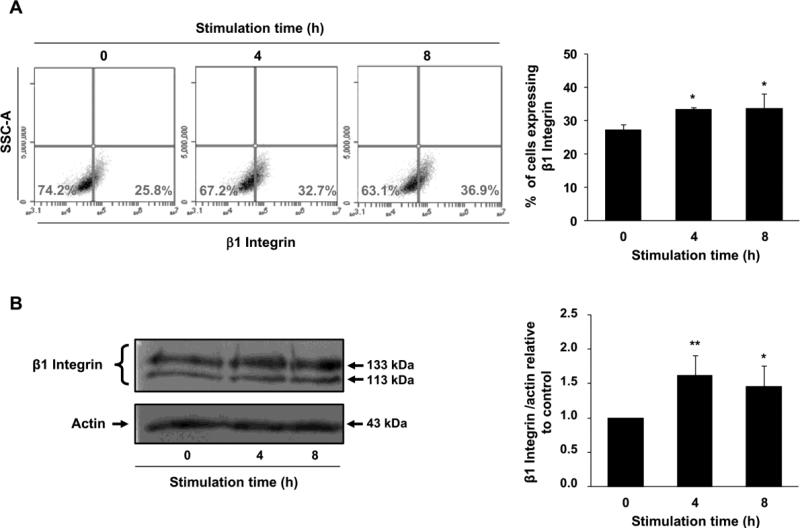
Fig. 2.
β1 integrin expression after treatment of Swan 71 cells with G-CSF. Non-confluent monolayers of Swan 71 cells maintained 24 h in serum-free medium were incubated for 4 and 8 h in the absence or presence of 100 ng/ml of G-CSF. (A) After washing with PBS, cells were fixed with 1% paraformaldehyde and β1 integrin expression was analyzed by flow cytometry under the conditions described in Material and methods. Dot plots of one representative experiment are shown. Results are expressed as the media ± SE of three independent experiments (right panel). Statistical analyses were performed by one-way ANOVA followed by Bonferroni post-hoc tests. * p<0.05, significantly different from non-stimulated cells. (B) Cell lysates were subjected to SDS-PAGE under the conditions described in Material and methods. Western blot assays were performed with an anti-β1 integrin or anti-actin antibody. Results from one representative experiment are shown (left panels). Data quantification was performed by densitometric analysis (right panel). Statistical analyses were performed by one-way ANOVA followed by Bonferroni post-hoc tests. * p<0.05, ** p<0.01, (n=5), significantly different from non-stimulated cells.

