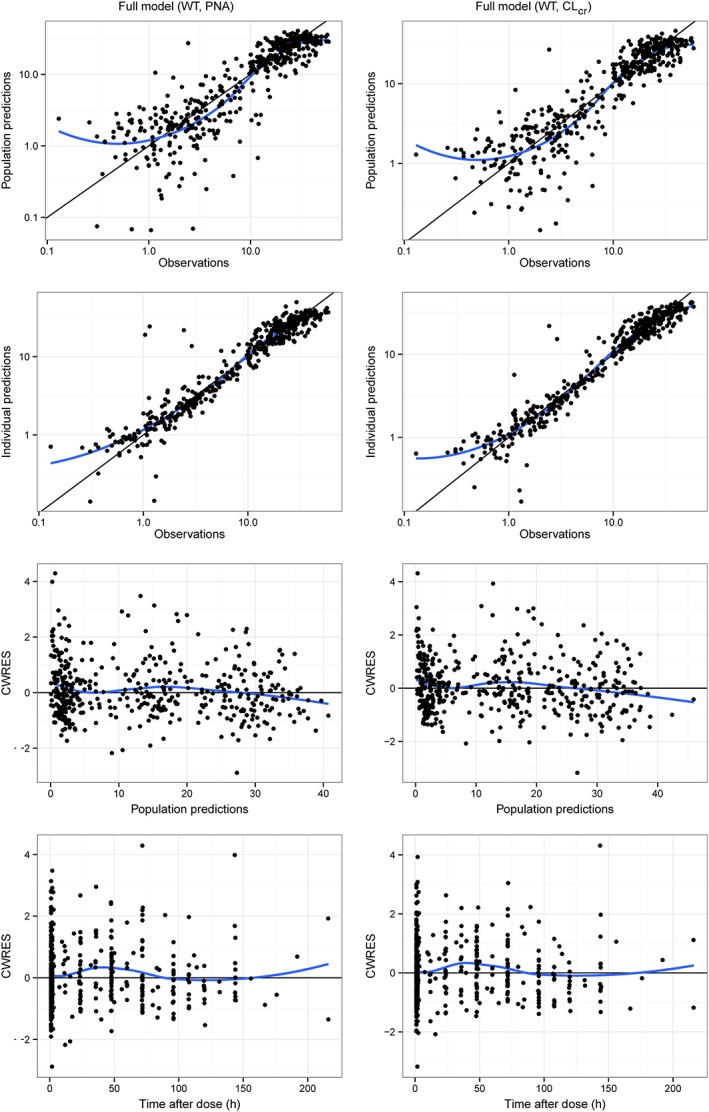
Figure 1.

Goodness‐of‐fit comparison of the two full covariate models: WT‐PNA (left) and WT‐CLcr (right). Population predictions (top panel) and individual predictions (middle panel) vs. observations; conditional weighted residuals (CWRES) vs. population predictions and time after dose (bottom panel). The blue lines represent loess smoothers
