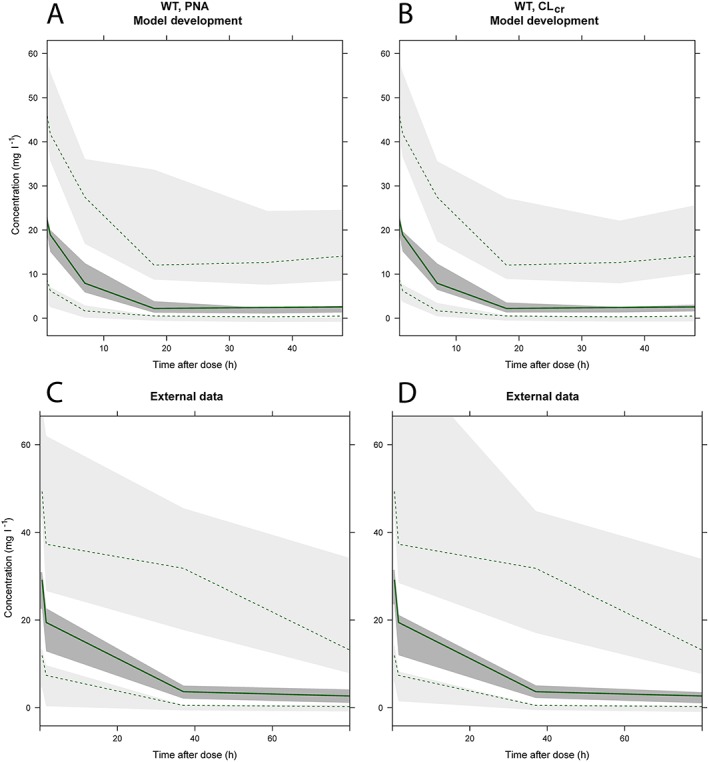
Figure 2.

Visual predictive checks (VPC) of full covariate models based on WT‐PNA (A and C) and WT‐CLcr (B and D), for model development (top) and external evaluation (bottom). The dashed lines and light grey areas represent the 2.5th and 97.5th percentiles for observed and simulated concentration‐time profiles. The solid line and dark grey area represent the median observed and simulated concentration‐time profiles
