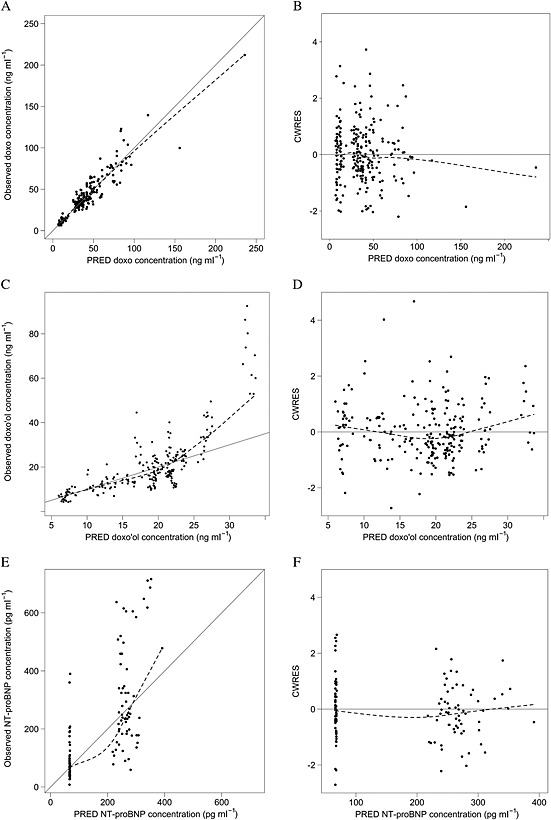
Figure 2.

Goodness‐of‐fit plots for the population pharmacokinetic models of doxorubicin (doxo) and doxorubicinol (doxo'ol), and the pharmacodynamic model of dox‐induced N‐terminal pro‐brain natriuretic peptide (NT‐proBNP) production. Identity plot of observed vs. population‐predicted (PRED) concentrations of doxo (A), doxo'ol (C) and NT‐proBNP (E). Scatter plot of conditional weighted residuals (CWRES) vs. PRED concentration of doxo (B), doxo'ol (D) and NT‐proBNP (F). Points represent the observations; dashed line shows smoothed (loess) line through the data; the solid line shows the line of identity in panels A, C and E
