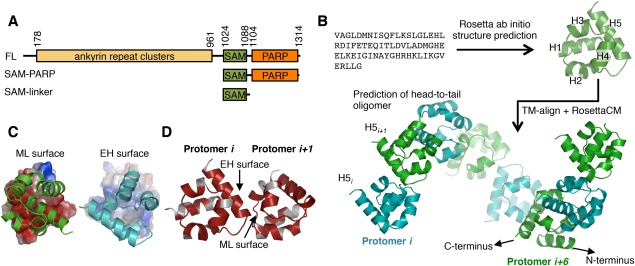
Figure 1.

Modeling tankyrase SAM domain oligomerization. (A) The TNKS1 domain architecture and constructs used in this manuscript. TNKS2 is homologous to TNKS1, but lacks a ∼170 amino acid N‐terminal histidine serine proline rich region in Tankyrase 1. FL; full‐length. (B) Schematic of the TNKS1 SAM domain structure and oligomeric structure prediction workflow. First, the amino acid sequence was used for structure prediction using Rosetta, followed by a TM‐align search for similar folds participating in SAM‐SAM interactions used as initial docking positions for a RosettaCM TNKS1 oligomer modeling protocol with helical symmetry. H1‐5; Helix 1, 2, 3, 4, and 5. Protomers are colored either green or cyan to clarify oligomeric structure. (C) Surface charges experienced by opposing faces of the oligomer protomers. Between the two interacting surfaces, the mid‐loop (ML) surface (left) is negatively charged (red), whereas the end‐helix (EH) surface is enriched in positively (blue) charged residues (right). (D) Conservation of residues between TNKS1 and TNKS2 plotted on the surface of the TNKS1 model showing sequence identity (red) at the interface of the two protomers. White; non‐identical. See also Supporting Information Figure S1.
