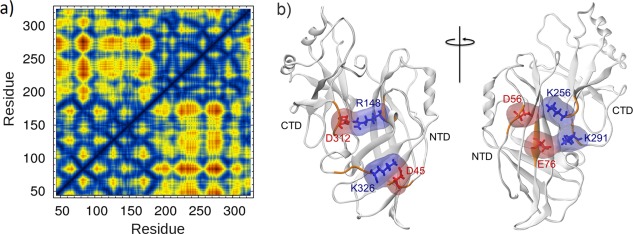
Figure 1.

(a) Amino acid contact map of the VP40 protomer. The blue regions (<5 Å) in the lower right block display the NTD‐CTD interdomain contacts within 5 Å distance (b) VP40 inter‐domain salt‐bridges. Red are negatively charged amino acids and blue are positively charged.
