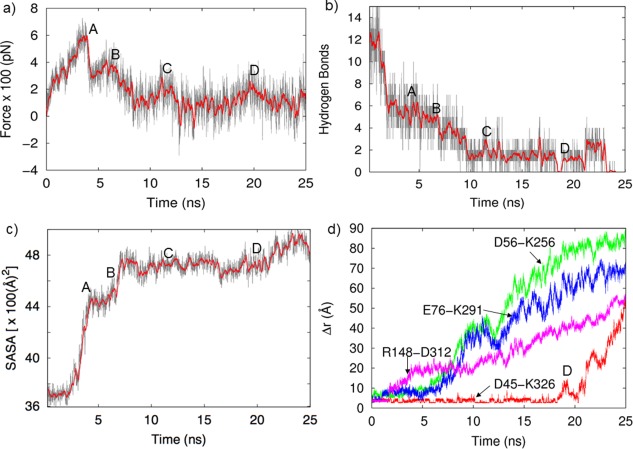
Figure 3.

(a) SMD force necessary to keep the CTD moving at constant speed away from the NTD (gray curve: full data, red curve: time averaged data with 200 ps windows), (b) Time evolution of the number of hydrogen bonds in the interface, (c) solvent accessible surface area (SASA) of hydrophobic residues at the NTD‐CTD interface, and (d) various interfacial salt‐bridges distance.
