Figure 4.

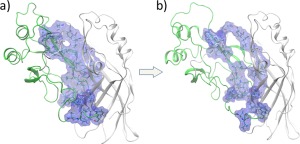
Hydrophobic residues at the domain–domain interface. (a) Initial closed‐form. (b) After the domains begin to separate (∼4 ns), gaps open at the hydrophobic interface, exposing SASA as quantified in Figure 3(c).

Hydrophobic residues at the domain–domain interface. (a) Initial closed‐form. (b) After the domains begin to separate (∼4 ns), gaps open at the hydrophobic interface, exposing SASA as quantified in Figure 3(c).