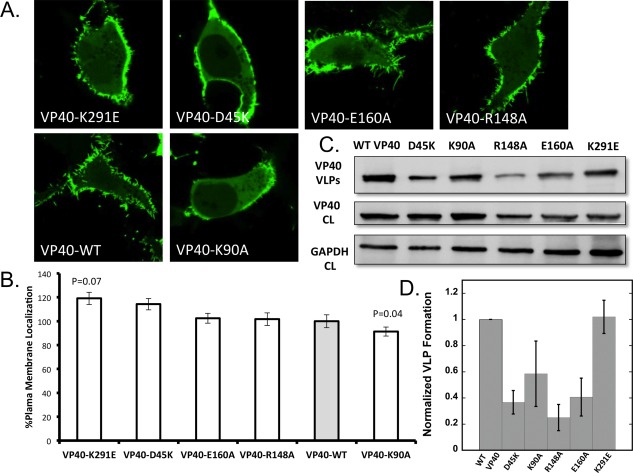
Figure 6.

Cellular localization and VLP analysis of interdomain NTD−CTD salt‐bridge mutants. (a) Representative images of VP40‐EGFP constructs imaged 18–24 h post transfection into HEK293 cells. All images were acquired with a zoom of 8.0, therefore, the frame size is 20 μm and equivalent for all images. (b) Average plasma membrane localization for each construct. Image analysis was performed in MATLAB to determine the %PM localization for each. Error bars are ± the standard error of the mean. At least 28 cells were imaged per construct over three independent experiments on three different days. (c) Representative blots of VP40 and respective mutations in VLPs (top panel) or cell lysates (middle panel) or GADPH from cell lysates (bottom panel). (d) WT‐VP40 VLP formation was set at 1 and each mutant was compared to WT‐VP40 as fraction a of VLP formation. The bars represent the averages ± standard errors of the means for three independent experiments quantified using ImageJ. P‐values for mutations were 0.002 for D45K, 0.001 for R148A, and 0.004 for E160A. K90A and K291E P‐values were not statistically significant.
