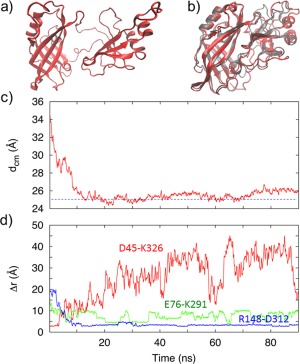
Figure 7.

(a) Initial structure of the open‐form of the VP40 used in the association MD simulations. (b) The final closed‐formed structure at the end of the 100‐ns association simulation, along with the PDB structure of the closed‐form for reference. (c) Separation between the NTD center of mass (cm) and the CTD cm. The horizontal line at approximately 25 Å represents the cm separation in the WT. (d) Time course of the separation between the amino acids that make each of the three important salt‐bridges during domain–domain association.
