
Figure 2.
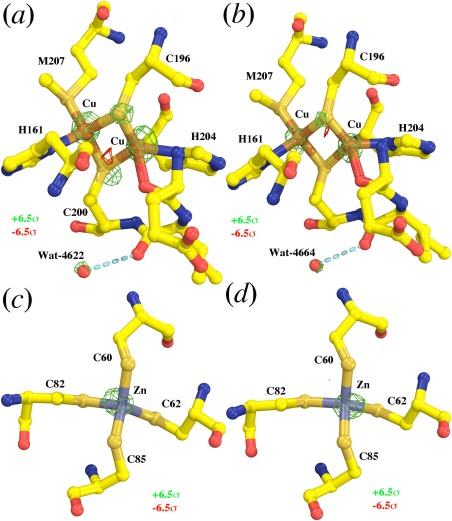
Relative loss of scattering powers of Cu, Zn, and S atoms in the XFEL 3WG7 data set revealed from the F(2DYR)‐F(3WG7) difference Fourier map. (a, b) The first and second copies of CcO molecules in the structure for the di‐copper cluster. (c, d) The first and second copies of CcO molecules in the structure for the Zn‐(Cys)4 motif. The map is contoured at ±6.5σ (green and red) and superimposed onto the 2DYR model.