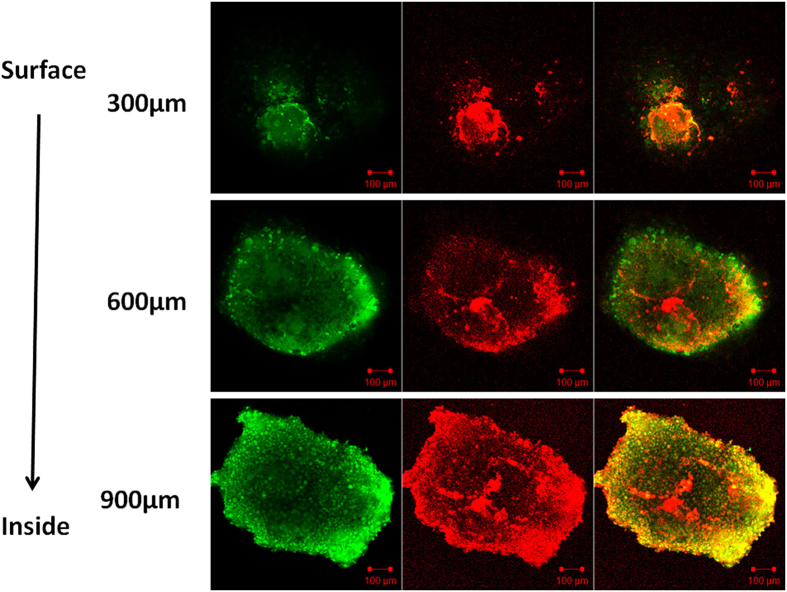
Figure 9. Confocal micrographs of the MCF-7 spheroid uptake of DiI-labelled 3-D microparticles and their intracellular distribution.
The green fluorescence on the left represents cells under 488 nm laser excitation, the red fluorescence in the middle represents microparticles under 549 nm laser excitation; the green and red fluorescence on the right depicts the merged images of both the red and green fluorescence. After incubation with DiI-labelled microparticles for 7 days, 2-D tumor cells successfully formed 3-D spheroids. The green fluorescence labelled the cytoplasm and the red fluorescence labelled the microparticles, which accumulated in the cytoplasm. The distribution of the microparticles was analyzed by confocal microscopy using Z-stack imaging with 300 μm intervals. Scale bars represent 100 μm.

