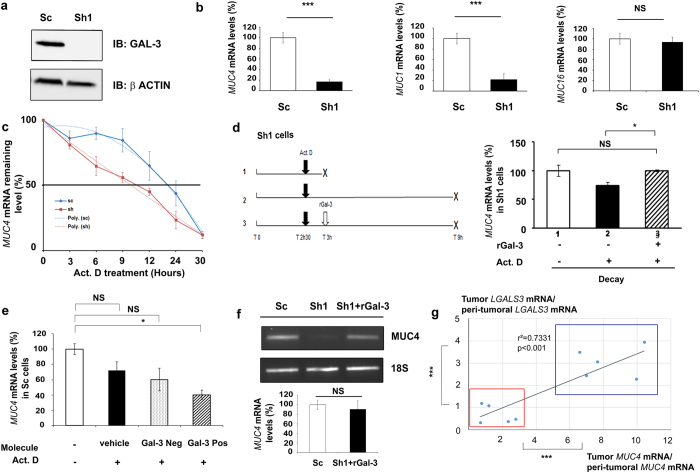
Figure 1. Galectin-3 increases MUC4 mRNA stability by a post-transcriptional mechanism.
(a) Gal-3 expression was analysed in whole cell protein extracts by western blotting. β-actin was used as a loading control. Blots are representative of three independent experiments. (b) MUC4, MUC1 and MUC16 mRNA levels were quantified in Sc and Sh1 cells by RT-qPCR. 18S RNA was used as an internal control. Results (mean ± SD) are expressed in comparison with the mRNA levels present in Sc cells (arbitrarily set at 100%); n = 3. (c) Decay curves of MUC4 mRNA in Sc and Sh1 cells cultured in the presence of 8 μg/ml actinomycin-D (Act. D) for the indicated times. Values represent percentage of the remaining mRNA levels. Interpolating spline curve appeared in dotted line; n = 3. (d) Right, Decay of MUC4 mRNA levels assessed by RT-qPCR on a 6 h period time of an Act. D treatment (between T 3 h and T 9 h) in presence or absence of rGal-3. Crosses on figure indicate mRNA collection. Results (mean ± SD) are expressed in comparison with MUC4 mRNA level present in condition 1 (arbitrarily set at 100%); n = 3. Left, scheme describing the experimental procedure. (e) Sc cells were treated for 6 h with 200 μM of a Galectin-3 competitive inhibitor (Gal-3 Pos), a structurally relative negative control (Gal-3 Neg) or vehicle in association with Act. D. MUC4 mRNA and 18S RNA were quantified by absolute qPCR. Results (mean ± SD) are expressed in comparison with MUC4 mRNA level present in condition without Act. D (arbitrarily set at 100%); n = 2. (f) Influence of a rGal-3 treatment in Sh1 cells (36 h, 4 μM) on MUC4 mRNA levels assessed by RT-PCR analysis (18S RNA as an internal control, n = 3) Densitometric analysis of the bands was performed using ImageQuanTL software. (g) Total RNAs were extracted from 10 human pancreatic ductal adenocarcinomas (cancer (tumoral) and surrounding healthy (peri-tumoral) pancreatic tissues). MUC4, LGALS3 and 18S RNA were quantified by RT-qPCR. Results are expressed as an induction factor of MUC4 and LGALS3 expression in comparison with the corresponding healthy pancreatic tissue (mRNA level arbitrarily set at 1). *p < 0.05; ***p < 0.001; NS: not significant by Student’s t-test.

