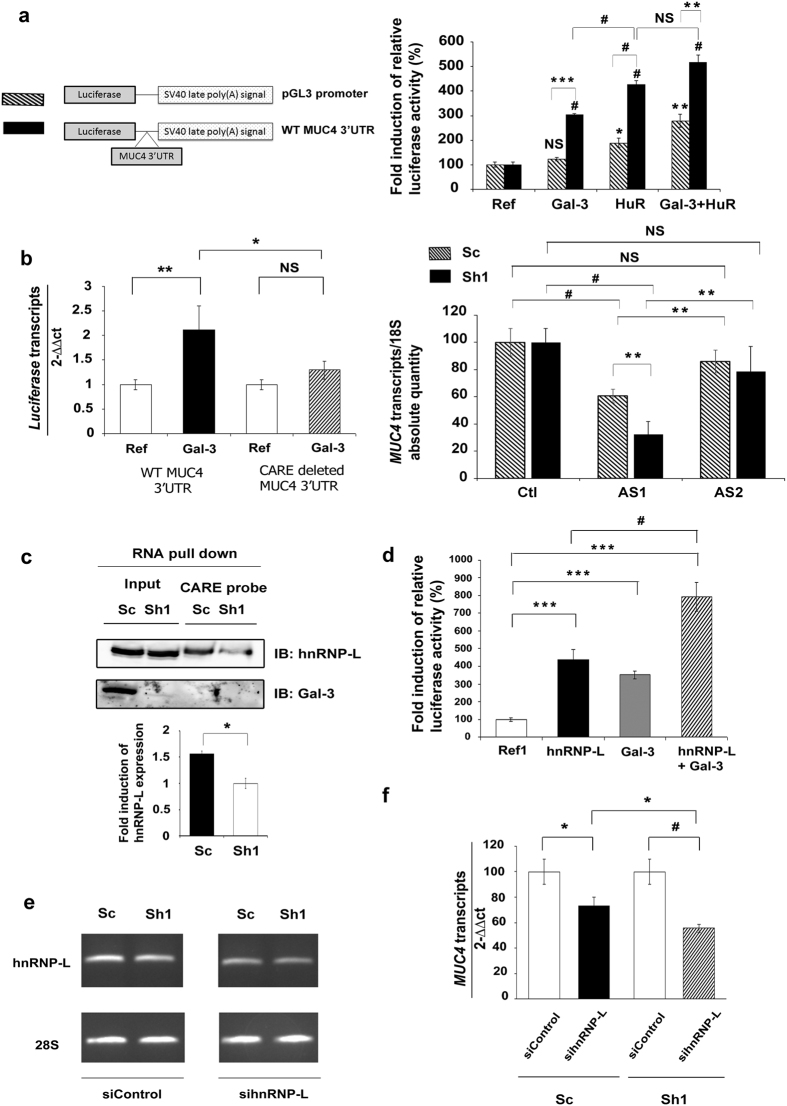
Figure 2. Mechanism of action of Galectin-3 on the 3′UTR of MUC4 mRNA.
(a) Left, schematic representation of pGL3 promoter or WT MUC4 3′UTR constructs. Right, Sh1 cells were transfected with the pGL3 promoter (hatched bars) or the MUC4 3′UTR luciferase reporter vector (black bars). pCMV6-XL4 Gal-3 and/or pCDNA3 HuR expression vectors were co-transfected. pSV-β-galactosidase expression vector was used as a co-transfection control. Luciferase activity was normalized to β-galactosidase activity. A 100% ratio was set for transfection performed with the corresponding reference. Results are presented as mean ± SD, n = 3. (b) Left panel: Sh1 cells were transfected with luciferase vector constructs containing wild-type or CARE-deleted MUC4 3′UTR, and co-transfected or not with pCMV6-XL4 gal-3 expression vector. Luciferase and GAPDH transcripts were quantified by RT-qPCR. Results are presented as mean ± SD, n = 3. Right panel: Sc cells (hatched bars) and Sh1 cells (black bars) were transfected with antisense oligonucleotides targeting either the CARE (AS1) or a region from the MUC4 3′UTR devoid of a regulatory element (AS2), or without oligonucleotide as a control (Ctl). MUC4 and 18S RNA were quantified by RT-qPCR. MUC4 mRNA level present in “Ctl” was set arbitrarily at 100%. Results are presented as mean ± SD, n = 3. (c) Biotinylated RNA probe corresponding to the CARE of MUC4 3′UTR was incubated with Sh1 or Sc whole cell extracts (100 μg) and the interaction with hnRNP-L or Gal-3 was assessed by western blot. Input: 25 μg of whole cell extracts. Blots are representative of 2 independent experiments. Densitometric analysis of the bands was performed using ImageQuanTL software. (d) Sh1 cells were transfected as indicated in (a). pCMV6-XL4 gal-3, pCMV6-XL5 hnRNP-L expression vectors were used separately or combined. Results are presented as mean ± SD, n = 3. (e) Determination of siRNA activity by semi-quantification of hnRNP-L mRNA level by RT-PCR in treated cells with siRNA targeting hnRNP-L or non-targeting siRNA (siControl). (f) MUC4 and GAPDH transcripts were quantified by qPCR after hnRNP-L inhibition by specific siRNA during 48 h. Results were expressed in comparison with siControl (arbitrarily set at 100%). Results are presented as mean ± SD, n = 3. *p < 0.05; **p < 0.02; #p < 0.01; ***p < 0.001; NS, not significant by Student’s t-test.

