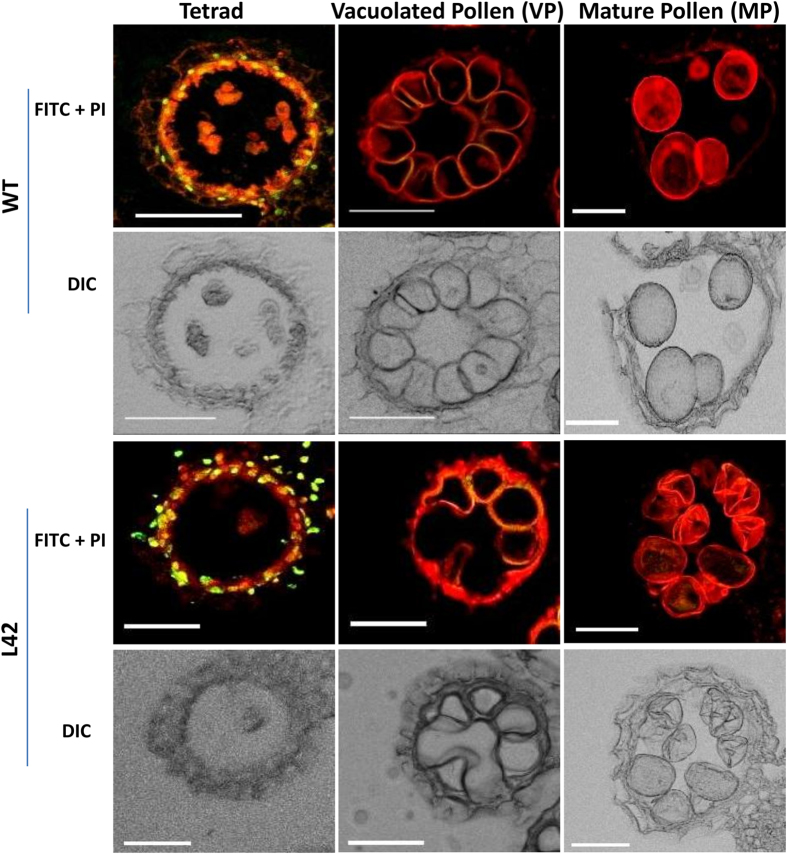
Figure 5. bHLH142 overexpressing anther shows abnormal programmed cell death in tapetum.
TUNEL assay showing PCD undergoing cells as greenish-yellow signal due to merging of FITC signals and propidium iodide (PI) stain and normal cells appear red due to propidium iodide stain only. Images were taken from confocal microscope in FITC (Fluorescein isothiocyanate), PI and DIC (Differential interference contrast) channels. Merge image of FITC and PI are shown in fluorescent panel while DIC images are shown separately. Scales: 50 μm.

