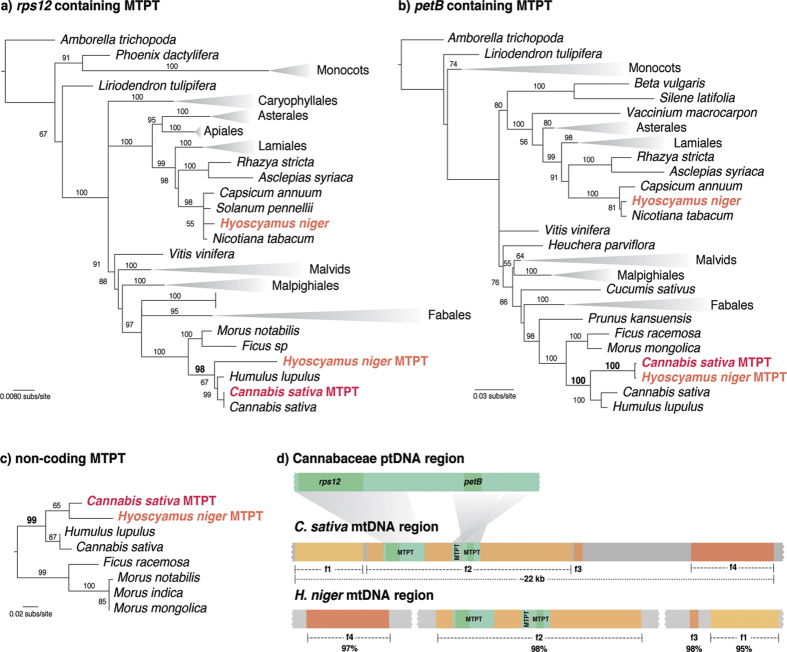
Figure 2. HGT from the family Cannabaceae to Hyoscyamus niger mtDNA.
(a–c) Evidence of HGT from Cannabis sativa to H. niger mtDNA. Maximum likelihood trees of the plastid sequences rps12 (a), petB (b), and a non-coding region (c) are shown and include sequences located in the plastid or mitochondrial (MTPT) genomes of angiosperms. Several branches are collapsed and shown as triangles for clarity; the full trees are shown in Figure S2. Bootstrap support values >50% are shown above the branches. (d) Plastid (ptDNA) and mitochondrial (mtDNA) genomic comparisons of C. sativa and H. niger. The percent identity between mitochondrial homologous regions (f1–f4) found in C. sativa and H. niger are shown below the H. niger mtDNA.

