Abstract
Next generation sequencing of the RNA content of single cells or single nuclei (sc/nRNA-seq) has become a powerful approach to understand the cellular complexity and diversity of multicellular organisms and environmental ecosystems. However, the fact that the procedure begins with a relatively small amount of starting material, thereby pushing the limits of the laboratory procedures required, dictates that careful approaches for sample quality control (QC) are essential to reduce the impact of technical noise and sample bias in downstream analysis applications. Here we present a preliminary framework for sample level quality control that is based on the collection of a series of quantitative laboratory and data metrics that are used as features for the construction of QC classification models using random forest machine learning approaches. We’ve applied this initial framework to a dataset comprised of 2272 single nuclei RNA-seq results and determined that ~79% of samples were of high quality. Removal of the poor quality samples from downstream analysis was found to improve the cell type clustering results. In addition, this approach identified quantitative features related to the proportion of unique or duplicate reads and the proportion of reads remaining after quality trimming as useful features for pass/fail classification. The construction and use of classification models for the identification of poor quality samples provides for an objective and scalable approach to sc/nRNA-seq quality control.
1. Introduction
Single cell genomic analysis is poised to revolutionize our understanding of the diversity and complexity of multicellular organisms. One of the key applications of single cell genomics is the determination of transcriptional profiles using next generation sequencing of amplified cDNA synthesized from the RNA content of single cells or single nuclei (sc/nRNA-seq). By avoiding the averaging phenomenon inherent in the analysis of bulk cell populations, sc/nRNA-seq is revealing a level of cell type complexity and dynamics that is unprecedented in comparison with previous technologies.
sc/nRNA-seq has now been applied to explore a wide range of biological questions. It has been used to understand the heterogeneity of somatic mutations acquired in cancer subclones arising from the same progenitor [Patel 2014][Min 2015], providing insights into therapeutic responses and disease progression. sc/nRNA-seq has been used to track cell state transition dynamics during normal tissue differentiation [Nestorowa 2016], cell cycle progression [Scialdone 2015], and in vitro trans-differentiation induced using direct reprogramming methodologies [Treutlein 2016]. It has also been used to investigate the dynamics of X chromosome inactivation in preimplantation embryos [Petropoulus 2016], lineage determination during blastocyst development [Blakeley 2015], T cell receptor repertoires in antigen-specific immune responses [Eltahla 2016], T cell progressive cell states [Proserpio 2016], variability in cellular responses to viral infections [Ciuffi 2016], and the similarities between induced pluripotent stem cell-derived neurons and cells from primary tissue and cortical layers [Handel 2016]. And at its most basic level, sc/nRNA-seq is being used to understand the complexity of steady state cell type distributions in normal human tissues [Zeisel 2015][Wang 2016][Lacar 2016][Li 2016], and abnormal tissue disorders [Ramsköld 2012][Glaublomme 2015][Tirosh 2016].
RNA-seq from single nuclei (Grindberg, 2013) provides transcriptomes that strongly reflect those obtained from whole cells. Nuclei can be used in place of cells to assess cell type and state, as well as revealing mRNAs and non-coding RNAs that are differentially enriched in the nucleus. The use of nuclei as a starting material also has the advantage of providing individual transcriptomes without the harsh proteolytic treatment required to disperse single cells from intact tissue specimens, which is known to alter gene expression and damage sensitive cell types. snRNA-seq has enabled single neuron studies even from postmortem human brain tissue (Krishnaswami, 2016). Use of nuclei for RNA-seq enabled the first single neuron analysis of immediate early gene expression associated with memory formation in the mouse hippocampus, whereas proteolytic dissociation of neurons yielded artifactual expression in most cells (Lacar, 2016). In this study we use data from single nuclei RNA-seq, however, the QC analysis proposed should be equally applicable to single cell data.
While the promise of sc/nRNA-seq is enormous, the methods used to isolate and specifically amplify the RNA target material in a manner that preserves the molecular structures and abundance levels pushes the limits of these technologies. As a result, the impact of contaminating nucleic acid templates (e.g. chromosomal and other contaminating DNAs, rRNA, mtDNA), technical variability in laboratory reagents and procedures (e.g. variability in the efficiencies of enzymatic reactions, quality of oligonucleotide reagents, plate position effects, reagent stability), biological variability (e.g. eQTL effects) can introduce noise and bias into the resulting sequence read data that can be difficult to control. Thus, the combination of technical noise and intrinsic biological variability makes the detection of and control for technical artifacts challenging. For this reason, the development and implementation of rigorous quality control procedures throughout the entire laboratory and informatics workflow is essential in order to assess, improve and optimize both the wet lab and dry lab component steps in order to obtain optimal transcript expression values for downstream analysis.
Here we describe an approach to quality control (QC) for sc/nRNA-seq assays in which we capture over 70 different quantitative laboratory and data metrics and use these quality metrics to construct QC classification models that can be used to filter out poor quality samples from downstream analysis. We’ve applied this QC approach in the context of a project to define the cell type complexity of the human brain neocortex in a collaboration involving the Allen Institute for Brain Science, the J. Craig Venter Institute, and Illumina, Inc.
2. Methods and Results
Laboratory and Informatics workflows
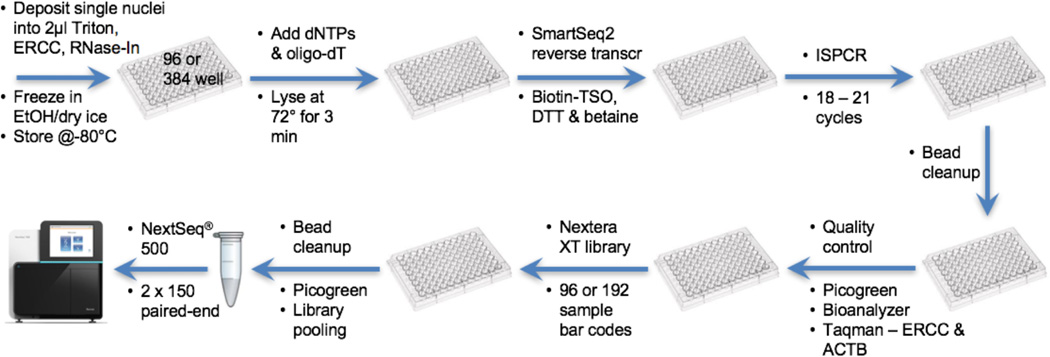
Our standard laboratory workflow for single nuclei RNA-seq is summarized in Figure 1 and is based on the detailed protocol described previously [Krishnaswami 2016]. Single nuclei are sorted into 96- or 384-well plates containing 2 µL 0.2% Triton X-100, 2 Units/µL RNase inhibitor, 1:2000000 dilution of ERCC spike-in RNAs (Life Technologies) per well and frozen immediately in an ethanol/dry ice bath. The ERCC external RNA control, consisting of 92 transcripts derived from NIST-certified plasmids that mimic natural eukaryotic mRNAs, is used to measure limits of detection and dynamic ranges, and can also be used to help quantify differential gene expression. Amplified cDNA is prepared using a Smart-Seq2 modification [Ramsköld 2012, Krishnaswami 2016] to our previous method [Grindberg 2013] to improve amplification of transcript 5’ ends. cDNA quality is evaluated using Taqman qPCR for selected housekeeping (ACTB), ERCC, and sample-specific genes. Using the single nuclei amplified cDNA, bar coded libraries are prepared and 60 sample pools are used for next generation sequencing using paired end 2×150 chemistry on an Illumina NextSeq® 500 instrument. In each of our pools we also include a small number of positive (diluted, purified human RNA from bulk samples) and negative controls (water only, ERCC only). Sequencing results are quality controlled (QC) as described below, including the use of the laboratory-derived ACTB and ERCC Ct qPCR values, Bioanalyzer length distribution metrics, and picogreen cDNA concentration values.
Figure 1. Single cell RNA-seq laboratory workflow.
See text and [Krishnaswami 2016] for details. Abbreviations used: External RNA Controls Consortium RNA spike-in control (ERCC), RNase inhibitor (RNase- In), template switching oligonucleotide (TSO), Dithiothreitol (DTT), and beta-actin (ACTB). For Research Use Only. Not for use in diagnostic procedures.
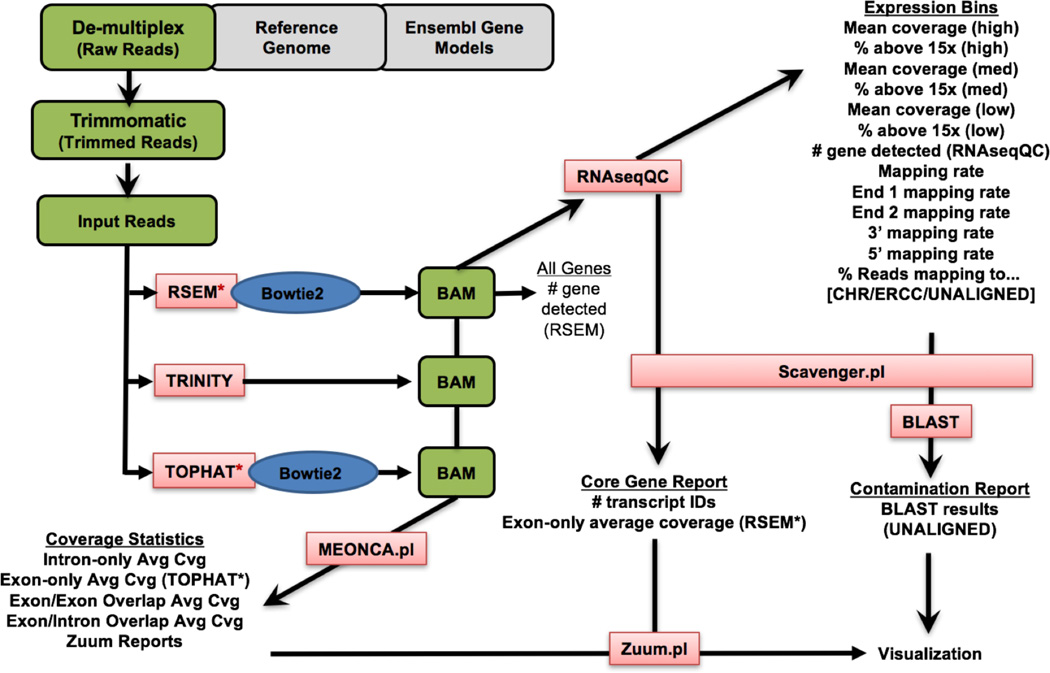
Our standard operating procedure (SOP) for data processing includes steps for primer and quality trimming, read alignment, transcript assembly, and expression quantification as summarized in Figure 2, and has been described in detail in a recent Nature Protocol publication [Krishnaswami 2016]. After demultiplexing, cDNA, PCR, and library/bar code primer sequences and low quality reads are removed from the primary read-level data using Trimmomatic, producing the input reads for downstream steps. The input reads are fed into several downstream pipelines - RSEM (Bowtie2/EM) for transcript quantification, and TopHat (Bowtie2/Cufflinks), fastQC, MEONCA and SCavenger for quality control metric assessment. MEONCA and SCavenger are in-house developed methods that will be described elsewhere.
Figure 2. Single cell RNA-seq data processing workflow.
Our standard operating procedure is based on the use of the Bowtie2/RSEM combination for sequence alignment, assembly, and transcript quantification. In addition, the ouput of a variety of additional workflows produce quantitative metrics used for assessment of sample and sequence quality. See text for details.
For the data included here, the following software and database versions were used:
GENCODE fasta and gtf files (http://www.gencodegenes.org/releases/current.html) Release 21 (GRCh38.p5);
FASTX Toolkit (http://hannonlab.cshl.edu/fastx_toolkit/download.html) v0.0.14;
fastQC (http://www.bioinformatics.babraham.ac.uk/projects/fastqc/) v0.10.1;
Picard toolkit (http://rseqc.sourceforge.net/) v1.137;
Trimmomatic (http://www.usadellab.org/cms/?page=trimmomatic) v0.35;
Bowtie2 (http://sourceforge.net/projects/bowtie-bio/files/bowtie2/) v2.2.7;
SAM tools (http://sourceforge.net/projects/samtools/files/samtools/) v1.3;
RSEM: (http://deweylab.biostat.wisc.edu/rsem/) v1.2.28;
Tophat (https://ccb.jhu.edu/software/tophat/index.shtml) v2.1.0;
Cufflinks (https://cole-trapnell-lab.github.io/cufflinks/) v2.2.1.
One of the primary objectives of our informatics pipeline is to identify poor quality samples for possible exclusion, to determine the causes of poor quality for sample preparation process improvement, and to identify marginal quality samples for downstream bioinformatics “normalization”. Because the determination of transcriptional profiles at a single cell level pushes the limits of next generation sequencing technologies, the rigorous approach we use for quality control is perhaps the most important aspect of the Single Cell Genomics Lab at JCVI.
Between the laboratory and data processing workflows described above, we collect 79 different quantitative measures that may reflect the quality of the input samples, processing steps, and resulting primary read-level data, which can be used to help address these objectives. Our approach is to use machine learning strategies, specifically random forest approaches, to classify individual sample data as either pass or fail for specific downstream analysis applications. In order to illustrate our approach, we describe the preliminary results from our work to develop a pass/fail classification model for a collaborative project between the JCVI Single Cell Genomics Lab, the Lein Group at the Allen Institute for Brain Science, and Illumina, Inc. to determine the transcriptional profiles for 2272 nuclei isolated from specific neo-cortex regions of post-mortem human brain.
Manual evaluation of fastQC results for QC model training
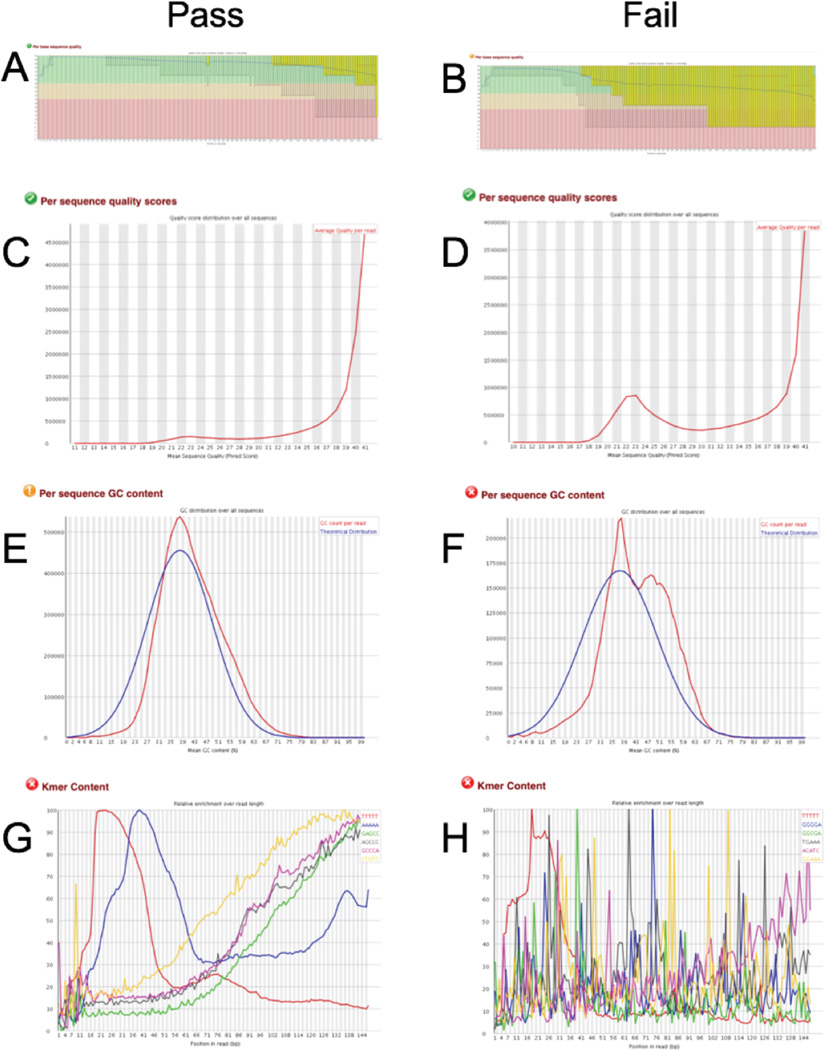
The first step in the development of machine learning classification models is to produce training data for model construction. For our purposes, we used a set of high confidence pass/fail calls for individual samples based on the qualitative assessment of data produced by fastQC, which includes quality Phred scores, GC content, Kmer distributions, and sequence over-representation information, for a random set of selected samples. Examples of these distributions are shown in Figure 3. Pass samples generally exhibit high average quality per read across the entire length of the sequenced fragment (Figure 3A & C). In contrast, Fail samples exhibit a significant number of reads with low mean quality, and quality scores that fall off down the length of the fragments (Figure 3B and D). High quality Pass samples also show an average GC content around 40%, reflecting the GC content of the expressed human transcriptome (Figure 3E). In contrast, some Fail samples show a second peak in the GC content distribution with a mean around 48% GC (Figure 3F); this peak appears to be generated from ERCC reads, which are derived from bacterial genome sequences.
Figure 3. fastQC results used to identify pass and fail samples.
Quality statistics produced by fastQC for representative Pass (A, C, E, G) and Fail (B, D, F, H) samples include average Phred score across the length of the read (A, B), average Phred score for the entire read (C, D), GC per read (E, F), and Kmer distribution across the length of the read (G, H).
Since we find that some Fail samples show reasonable Phred quality scores but overrepresentation of ERCC reads and vice versa, we distinguish between Fail samples due to low quality scores (Fail-Phred) and Fail samples due to ERCC over-representation (Fail-ERCC). Finally, Pass samples show a Kmer content distribution in which distinct polyA and polyT peaks can be observed toward the beginning of the read due to the use of oligo-dT priming in 1st strand cDNA synthesis (Figure 3G), whereas Fail sample often show a more random pattern (Figure 3H).
QC metric correlation with QC training data
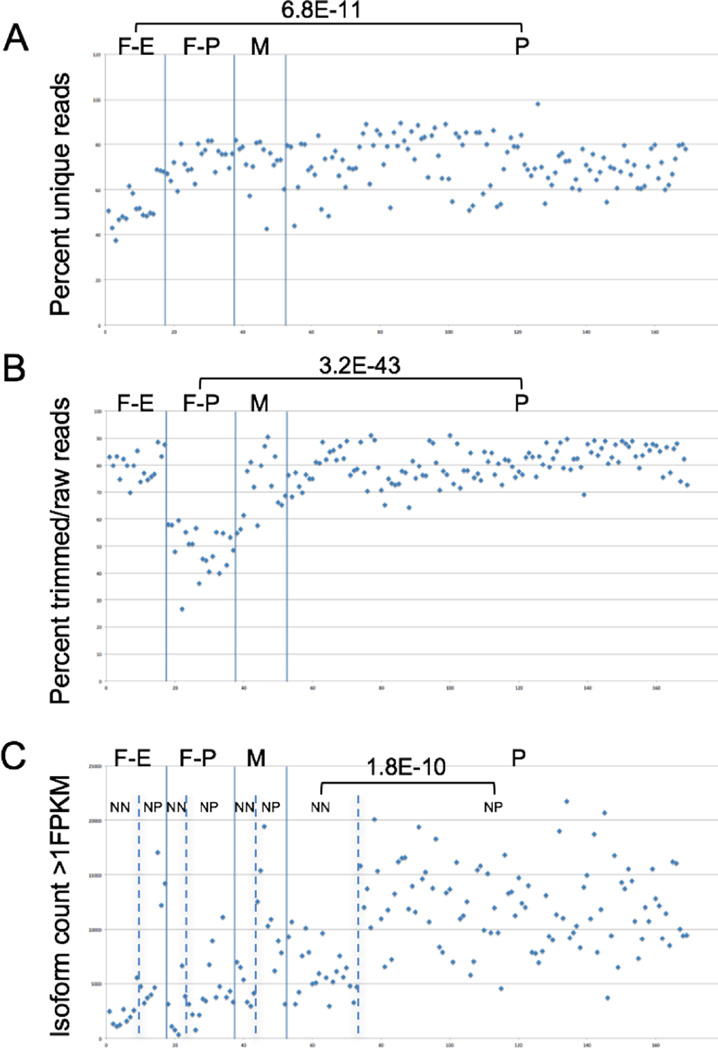
In order to produce training data for machine learning in the 2272 nuclei study, we selected 196 samples at random, including 169 single nuclei samples and 27 controls (positive and negative), and performed a blinded qualitative evaluation of the fastQC data, producing three classification labels – Pass (152 samples, including all positive controls), Fail-Phred (29 samples), and Fail- ERCC (15 samples) (all negative controls we correctly classified into one of the two Fail categories). Qualitative fastQC evaluation was chosen to produce training data since this approach is independent from the quantitative QC metrics produced by our core data processing workflows described above. A few examples of the correlation between fastQC Pass/Fail calls and the quantitative QC metrics is shown in Figure 4. For Fail-ERCC samples, the “percent unique reads” are significantly lower (p = 6.8E-11) than for the Pass samples (Figure 4A), probably due to the fact that with a greater proportion of ERCC reads, more duplicate reads would result. For Fail- Phred samples, the “percent trimmed/raw reads” are significantly lower than for the Pass samples (Figure 4B, p = 3.2E-43), presumably due to the fact that Trimmomatic removes reads of poor quality. For Pass samples, the number of transcript isoforms detected tends to be generally higher than the number of transcript isoforms detected in either type of failed sample (Figure 4C). However, we noted that there appeared to be a subset of Pass samples that had relatively low isoform counts, similar to what we observed in the Fail samples. It turns out that during the nuclei isolation step, we stain for the expression of a neuron-specific protein, NeuN, to ensure that we get a selection of both neuronal and non-neuronal cell types for our study. When we compared data for NeuN+ and NeuN- passed samples, we found that the isoform counts were significantly different between the two major cell type categories (p = 1.8E-10), with NeuN+ nuclei and NeuN-producing an average of 12,162 and 6,233 transcript isoforms with >1FPKM, respectively.
Figure 4. QC metrics in Pass and Fail samples.
Single nuclei samples were annotated as Pass (P), Fail-ERCC (F-E), Fail-Phred (F-P), and Marginal (M) based on subjective evaluation of the fastQC results (see text for details). The quantitative levels of three different QC metrics for these four classes of samples are shown. P-values were calculated using a 2-sided student’s t-test. NN – NeuN-; NP – NeuN+
Machine learning for high throughput QC processing
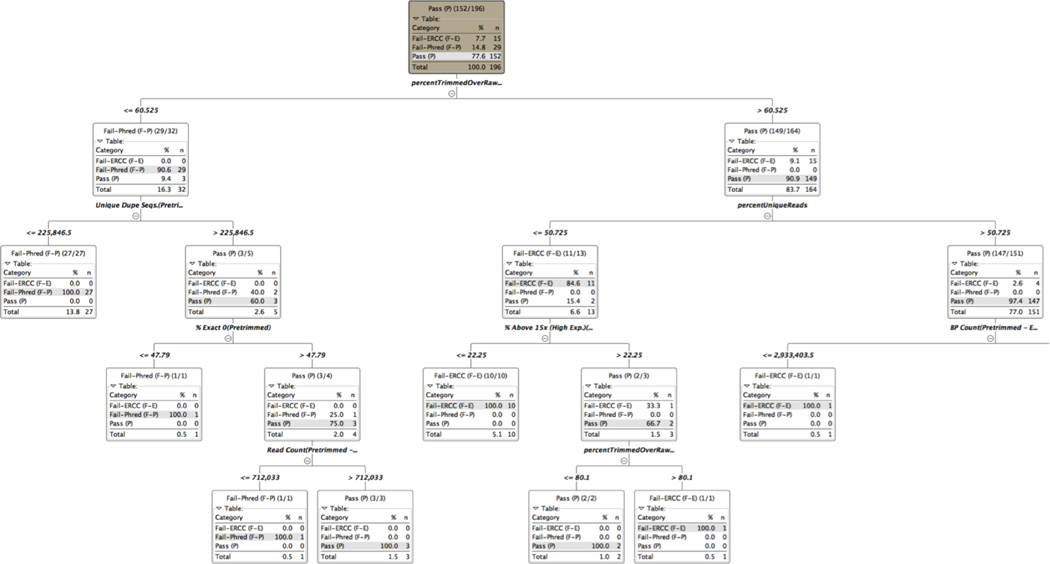
These quality annotation labels and QC metric values were then used to train the Random Forest algorithm as implemented in KNIME v3.1.2. We generated 100,000 decisions trees that could distinguish the three categories of samples. An example of a high scoring tree is shown in Figure 5 in which “percent trimmed over raw” is used at the first level and is effective at distinguishing Fail-Phred sample from both Pass and Fail-ERCC, and “percent unique reads” is used at the second level to distinguish Pass from Fail-ERCC, as also seen in Figure 4. A summary of the QC features that score high across the entire 100,000 decision tree collection is shown in Figure 6. Using this Random Forest classification model, all 196 samples in the training set were classified correctly with high confidence scores:
Pass: average confidence = 0.9689; standard deviation = 0.0524
Fail-Phred (F-P): average confidence = 0.8828; standard deviation = 0.0703
Fail-ERCC (F-E): average confidence = 0.8286; standard deviation = 0.0959
Figure 5. One of the 100,000 decision trees constructed from Random Forest training.
The tree shows the different branch point levels, the feature used to segregate the branches at each level, and the segregation of the Pass, Fail-ERCC and Fail-Phred samples at each branch point. The tree was truncated after the first three levels.
Figure 6. QC features most useful in Pass/Fail classification trees.
The top ten QC metrics found useful for Pass/Fail sample classification are listed together with the number of trees in which they were used for branching at levels 1, 2, and 3, and the number of times they were considered as candidates at that given level (due to the feature down-sampling used by the Random Forest algorithm. For example, percentTrimmedOverRawReads was considered as a candidate feature in 10977 level 1 branches and was selected as the best feature 10932 times.
To test the classification accuracy of the resulting random forest model, we used an independent test set of 185 single nuclei samples classified using the same fastQC evaluation criteria applied to the training data, with 135 determined to be Pass samples, 29 determined to be Fails and 21 determined to be Marginals. Application of the random forest model to these test Pass and Fail samples resulted in only 8 misclassifications (4.9%), for a classification accuracy of 95%. Marginal samples were split between Pass and Fail classification by the random forest model, with 8 Marginals classified as Pass and 12 classified as Fail.
Using this random forest model applied to the entire dataset, 79% of 2272 single nuclei samples passed quality control. For these samples, the average number of reads after trimming was 16,335,055 (±19,771,224), percent of hg38 mapped read was 33.04 (± 15.50), number of ERCC transcripts detected was 42.43 (± 4.37), and the number of genes detected at a level of >1FPKM was 6794 (± 2131), giving an average coverage of 793 reads per human gene detected. In contrast for Failed-ERCC samples, the average number of reads after trimming was 10,333,560 (±8,589,613), percent of hg38 mapped read was 12.18 (± 13.32), number of ERCC transcripts detected was 42.11 (± 4.73), and the number of genes detected at a level of >1FPKM was 2784 (± 1401), giving an average coverage of 452 reads per human gene detected. For Failed-Phred samples, the average number of reads after trimming was 6,763,387 (±6,167,257), percent of hg38 mapped read was 14.87 (± 12.54), number of ERCC transcripts detected was 39.60 (±12.14), and the number of genes detected at a level of >1FPKM was 2903 (± 1897), giving an average coverage of 346 reads per human gene detected. Removal of these poor quality samples was found to produce tighter cell type clusters in downstream PCA/biSNE analysis (data not shown).
Discussion/Conclusion
Many groups using sc/nRNA-seq to identify and quantify cellular diversity in complex tissue samples have recognized the critical importance of quality control procedures to obtain optimal results in downstream data analysis, and have used qualitative and quantitative assessment of single quality metrics for this purpose. These include abnormal expression of housekeeping genes (e.g. ACTB, GAPDH) [Ting 2014, Treutlein 2014], outlier clustering [Zeisel 2015, Jiang 2016], median expression value cutoffs [Pollen 2014], and number of genes detected or read mapping rate [Kumar 2014], each with their advantages and disadvantages. In this paper we have demonstrated the use of a machine learning approach, specifically random forest decision trees with a large combination of wet lab and dry lab quantitative metrics, to objectively perform this QC classification. The advantage of this approach is that not only does it provide for an objective, high-throughput pass-fail classification, but it also identifies those quantitative metrics that are most useful in identifying problematic samples.
In this study, we found that there appear to be at least two classes of failed samples, and that the metrics useful in identifying each are different. Failed samples with a second peak in the %GC content plot apparently due to reads derived from the ERCC spike-in control are identified by metrics like the % of exact duplicates and % of unique reads, presumably due to the fact that a relatively small number of transcripts derived from the ERCC control are responsible for a significant proportion of the total reads obtained from those samples. In contrast, failed samples with relatively poor quality scores (low Phred scores) are identified by metrics like the % of trimmed over raw reads, presumably due to the impact of poor quality data trimming by the Trimmomatic software. While there are some metrics that appear to be effective at identifying both classes of failed samples, e.g. the number of transcript isoforms with FPKM values greater than 1, these do not rank as high as the class-specific metrics in the useful feature list. This suggest that identifying and distinguish different types of failure modes may be useful for building QC classification models using machine learning approaches. And while both the three class prediction model used here and a two class prediction model constructed by grouping both fail categories into one showed perfect classification of the training data, the prediction confidence values for calling pass samples were slightly higher using the three class model.
In addition, we also find that the use of metrics related to the number of genes or transcript isoforms detected for quality control purposes should be approached cautiously since these may vary between different cell types, as we observed between our NeuN+ neurons and our NeuN-glial cells, or between different cellular states (e.g. cell cycle phase or activation state).
Recently, Ilicic et al. reported the use of support vector machine modeling to identify stressed/broken/killed cells, empty capture sites and sites with multiple cells in Fluidigm C1 flow cells using microscopic visualization as the gold standard for model training [Ilicic 2016]. They found seven features that were useful for classification independent of cell type and protocol – cytoplasm and mitochondrially-localized proteins, mtDNA-encoded genes, mapped reads, multimapped reads, non-exonic reads, and transcriptome variance. Differences between these and the features reported here could be due to the use of different quality metrics as input, the use of nuclei versus whole cells, or that different sorting platforms give rise to different poor quality modes. In any case, the approach reported here is advantageous because it does not require visual microscopic inspection to produce the gold standard results for model training and therefor can be applied in a high throughput fashion to data from any cell sorting platform. While the random forest model developed here has yet to be applied to a completely independent dataset, the test samples used to assess classification accuracy were derived from separate cDNA synthesis, PCR amplification, and library preparation reactions and sequencing runs. The fact that the model gave a 95% classification accuracy on this semi-independent dataset suggests that the feature included in the model are at least robust to technical batch effects.
In conclusion, the use of both wet lab and dry lab metrics for the production of a QC classification model using random forest machine learning appears to be an effective objective strategy for the quality control of sc/nRNA-seq samples, providing further insights into the data features that are most useful for identifying problematic samples.
Acknowledgments
This work is supported by the Allen Institute for Brain Science, the JCVI Innovation Fund, and the U.S. National Institutes of Health 1R21AI122100.
References
- Blakeley P, Fogarty NM, del Valle I, et al. Defining the three cell lineages of the human blastocyst by single-cell RNA-seq. Development. 2015 Sep 15;142(18):3151–3165. doi: 10.1242/dev.123547. Epub 2015 Aug 20. Erratum in: Development. 2015 Oct 15; 142(20)3613. PubMed PMID: 26293300; PubMed Central PMCID: PMC4582176. [DOI] [PMC free article] [PubMed] [Google Scholar]
- Ciuffi A, Rato S, Telenti A. Single-Cell Genomics for Virology. Viruses. 2016 May 4;8(5):pii: E123. doi: 10.3390/v8050123. Review. PubMed PMID: 27153082; PubMed Central PMCID: PMC4885078. [DOI] [PMC free article] [PubMed] [Google Scholar]
- Eltahla AA, Rizzetto S, Pirozyan MR, et al. Linking the T cell receptor to the single cell transcriptome in antigen-specific human T cells. Immunol Cell Biol. 2016 Jul;94(6):604–611. doi: 10.1038/icb.2016.16. Epub 2016 Feb 10. PubMed PMID: 26860370. [DOI] [PubMed] [Google Scholar]
- Gaublomme JT, Yosef N, Lee Y, et al. Single-Cell Genomics Unveils Critical Regulators of Th17 Cell Pathogenicity. Cell. 2015 Dec 3;163(6):1400–1412. doi: 10.1016/j.cell.2015.11.009. Epub 2015 Nov 19. PubMed PMID: 26607794; PubMed Central PMCID: PMC4671824. [DOI] [PMC free article] [PubMed] [Google Scholar]
- Grindberg RV, Yee-Greenbaum JL, McConnell MJ, et al. RNA-sequencing from single nuclei. Proc Natl Acad Sci U S A. 2013 Dec 3;110(49):19802–19807. doi: 10.1073/pnas.1319700110. Epub 2013 Nov 18. PubMed PMID: 24248345; PubMed Central PMCID: PMC3856806. [DOI] [PMC free article] [PubMed] [Google Scholar]
- Handel AE, Chintawar S, Lalic T, et al. Assessing similarity to primary tissue and cortical layer identity in induced pluripotent stem cell-derived cortical neurons through single-cell transcriptomics. Hum Mol Genet. 2016 Mar 1;25(5):989–1000. doi: 10.1093/hmg/ddv637. Epub 2016 Jan 5. PubMed PMID: 26740550; PubMed Central PMCID: PMC4754051. [DOI] [PMC free article] [PubMed] [Google Scholar]
- Ilicic T, Kim JK, Kolodziejczyk AA, et al. Classification of low quality cells from single-cell RNA-seq data. Genome Biol. 2016 Feb 17;17:29. doi: 10.1186/s13059-016-0888-1. PubMed PMID: 26887813; PubMed Central PMCID: PMC4758103. [DOI] [PMC free article] [PubMed] [Google Scholar]
- Jiang P, Thomson JA, Stewart R. Quality control of single-cell RNA-seq by SinQC. Bioinformatics. 2016 Apr 10;:pii: btw176. doi: 10.1093/bioinformatics/btw176. [Epub ahead of print] PubMed PMID: 27153613. [DOI] [PMC free article] [PubMed] [Google Scholar]
- Krishnaswami SR, Grindberg RV, Novotny M, et al. Using single nuclei for RNA-seq to capture the transcriptome of postmortem neurons. Nat Protoc. 2016 Mar;11(3):499–524. doi: 10.1038/nprot.2016.015. Epub 2016 Feb 18. PubMed PMID: 26890679; PubMed Central PMCID: PMC4941947. [DOI] [PMC free article] [PubMed] [Google Scholar]
- Kumar RM, Cahan P, Shalek AK, et al. Deconstructing transcriptional heterogeneity in pluripotent stem cells. Nature. 2014 Dec 4;516(7529):56–61. doi: 10.1038/nature13920. PubMed PMID: 25471879; PubMed Central PMCID: PMC4256722. [DOI] [PMC free article] [PubMed] [Google Scholar]
- Lacar B, Linker SB, Jaeger BN, et al. Nuclear RNA-seq of single neurons reveals molecular signatures of activation. Nat Commun. 2016 Apr 19;7:11022. doi: 10.1038/ncomms11022. PubMed PMID: 27090946; PubMed Central PMCID: PMC4838832. [DOI] [PMC free article] [PubMed] [Google Scholar]
- Li J, Klughammer J, Farlik M, et al. Single-cell transcriptomes reveal characteristic features of human pancreatic islet cell types. EMBO Rep. 2016 Feb;17(2):178–187. doi: 10.15252/embr.201540946. Epub 2015 Dec 21. PubMed PMID: 26691212; PubMed Central PMCID: PMC4784001. [DOI] [PMC free article] [PubMed] [Google Scholar]
- Min JW, Kim WJ, Han JA, et al. Identification of Distinct Tumor Subpopulations in Lung Adenocarcinoma via Single-Cell RNA-seq. PLoS One. 2015 Aug 25;10(8):e0135817. doi: 10.1371/journal.pone.0135817. eCollection 2015. PubMed PMID: 26305796; PubMed Central PMCID: PMC4549254. [DOI] [PMC free article] [PubMed] [Google Scholar]
- Nestorowa S, Hamey FK, Pijuan Sala B, et al. A single cell resolution map of mouse haematopoietic stem and progenitor cell differentiation. Blood. 2016 Jun 30; doi: 10.1182/blood-2016-05-716480. pii: blood-2016-05-716480. [Epub ahead of print] PubMed PMID: 27365425. [DOI] [PMC free article] [PubMed] [Google Scholar]
- Patel AP, Tirosh I, Trombetta JJ, et al. Single-cell RNA-seq highlights intratumoral heterogeneity in primary glioblastoma. Science. 2014 Jun 20;344(6190):1396–1401. doi: 10.1126/science.1254257. Epub 2014 Jun 12. PubMed PMID: 24925914; PubMed Central PMCID: PMC4123637. [DOI] [PMC free article] [PubMed] [Google Scholar]
- Petropoulos S, Edsgärd D, Reinius, et al. Single-Cell RNA-Seq Reveals Lineage and X Chromosome Dynamics in Human Preimplantation Embryos. Cell. 2016 May 5;165(4):1012–1026. doi: 10.1016/j.cell.2016.03.023. Epub 2016 Apr 7. PubMed PMID: 27062923; PubMed Central PMCID: PMC4868821. [DOI] [PMC free article] [PubMed] [Google Scholar]
- Pollen AA, Nowakowski TJ, Shuga J, et al. Low-coverage single-cell mRNA sequencing reveals cellular heterogeneity and activated signaling pathways in developing cerebral cortex. Nat Biotechnol. 2014 Oct;32(10):1053–1058. doi: 10.1038/nbt.2967. Epub 2014 Aug 3. PubMed PMID: 25086649; PubMed Central PMCID: PMC4191988. [DOI] [PMC free article] [PubMed] [Google Scholar]
- Proserpio V, Piccolo A, Haim-Vilmovsky L, et al. Single-cell analysis of CD4+ T-cell differentiation reveals three major cell states and progressive acceleration of proliferation. Genome Biol. 2016 May 12;17(1):103. doi: 10.1186/s13059-016-0957-5. Erratum in: Genome Biol. 2016;17(1)133. PubMed PMID: 27176874; PubMed Central PMCID: PMC4866375. [DOI] [PMC free article] [PubMed] [Google Scholar]
- Ramsköld D, Luo S, Wang YC, et al. Full-length mRNA-Seq from single-cell levels of RNA and individual circulating tumor cells. Nat Biotechnol. 2012 Aug;30(8):777–782. doi: 10.1038/nbt.2282. PubMed PMID: 22820318; PubMed Central PMCID: PMC3467340. [DOI] [PMC free article] [PubMed] [Google Scholar]
- Scialdone A, Natarajan KN, Saraiva LR, et al. Computational assignment of cell-cycle stage from single-cell transcriptome data. Methods. 2015 Sep 1;85:54–61. doi: 10.1016/j.ymeth.2015.06.021. Epub 2015 Jul 2. PubMed PMID: 26142758. [DOI] [PubMed] [Google Scholar]
- Ting DT, Wittner BS, Ligorio M, et al. Single-cell RNA sequencing identifies extracellular matrix gene expression by pancreatic circulating tumor cells. Cell Rep. 2014 Sep 25;8(6):1905–1918. doi: 10.1016/j.celrep.2014.08.029. Epub 2014 Sep 18. PubMed PMID: 25242334; PubMed Central PMCID: PMC4230325. [DOI] [PMC free article] [PubMed] [Google Scholar]
- Tirosh I, Izar B, Prakadan SM, et al. Dissecting the multicellular ecosystem of metastatic melanoma by single-cell RNA-seq. Science. 2016 Apr 8;352(6282):189–196. doi: 10.1126/science.aad0501. PubMed PMID: 27124452; PubMed Central PMCID: PMC4944528. [DOI] [PMC free article] [PubMed] [Google Scholar]
- Treutlein B, Brownfield DG, Wu AR, et al. Reconstructing lineage hierarchies of the distal lung epithelium using single-cell RNA-seq. Nature. 2014 May 15;509(7500):371–375. doi: 10.1038/nature13173. Epub 2014 Apr 13. PubMed PMID: 24739965; PubMed Central PMCID: PMC4145853. [DOI] [PMC free article] [PubMed] [Google Scholar]
- Treutlein B, Lee QY, Camp JG, et al. Dissecting direct reprogramming from fibroblast to neuron using single-cell RNA-seq. Nature. 2016 Jun 8;534(7607):391–395. doi: 10.1038/nature18323. PubMed PMID: 27281220; PubMed Central PMCID: PMC4928860. [DOI] [PMC free article] [PubMed] [Google Scholar]
- Wang YJ, Schug J, Won KJ, et al. Single cell transcriptomics of the human endocrine pancreas. Diabetes. 2016 Jun 30;:pii: db160405. doi: 10.2337/db16-0405. [Epub ahead of print] PubMed PMID: 27364731. [DOI] [PMC free article] [PubMed] [Google Scholar]
- Zeisel A, Muñoz-Manchado AB, Codeluppi S, et al. Brain structure. Cell types in the mouse cortex and hippocampus revealed by single-cell RNA-seq. Science. 2015 Mar 6;347(6226):1138–1142. doi: 10.1126/science.aaa1934. Epub 2015 Feb 19. PubMed PMID: 25700174. [DOI] [PubMed] [Google Scholar]


