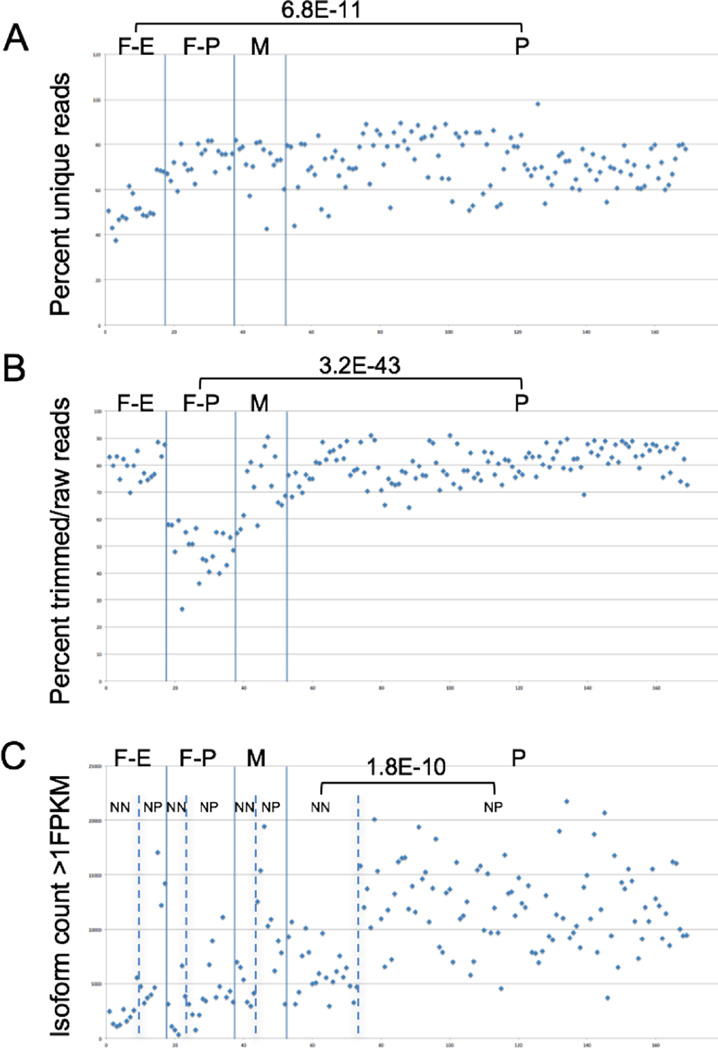
Figure 4. QC metrics in Pass and Fail samples.
Single nuclei samples were annotated as Pass (P), Fail-ERCC (F-E), Fail-Phred (F-P), and Marginal (M) based on subjective evaluation of the fastQC results (see text for details). The quantitative levels of three different QC metrics for these four classes of samples are shown. P-values were calculated using a 2-sided student’s t-test. NN – NeuN-; NP – NeuN+

