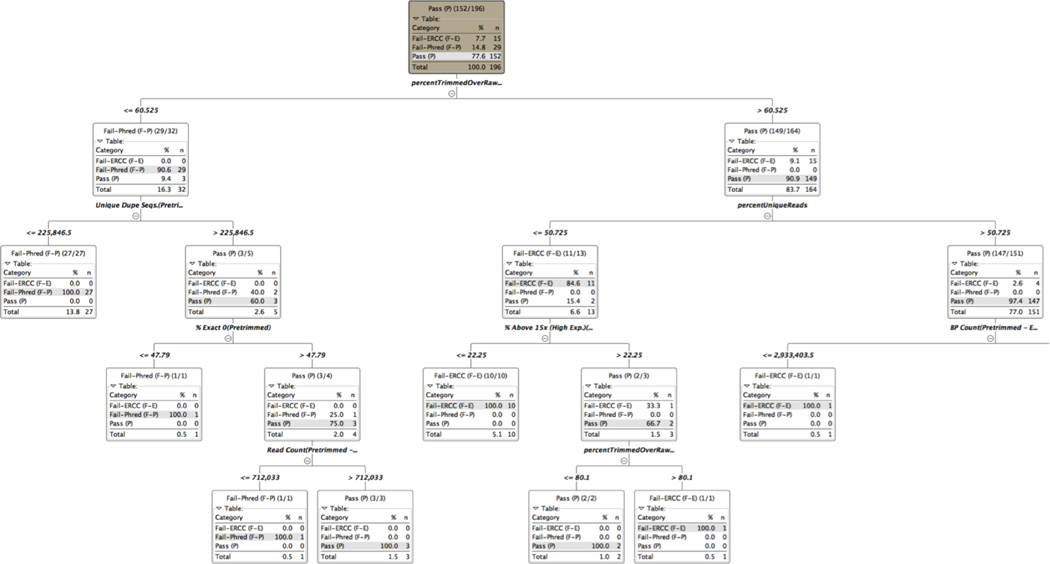
Figure 5. One of the 100,000 decision trees constructed from Random Forest training.
The tree shows the different branch point levels, the feature used to segregate the branches at each level, and the segregation of the Pass, Fail-ERCC and Fail-Phred samples at each branch point. The tree was truncated after the first three levels.

