
Figure 3.

The contour plot of the response coefficients |Sxxxx(−ωs, ωp)| at (a) T = 0 K and (b) T = 300 K for μ = 0.3 eV and Γ = 33 meV. The contour lines correspond to the values 1, 10, 50, and 100 in the units indicated. (c) An effective 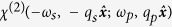 with the parameters taken from the experiment25 by Constant et al. Here ωi = 2πc/λi, and qi = ωi/c cos θi with i = s, p. The other parameters are μ = 0.5 eV, Γ = 6.62 meV, and T = 0 K.