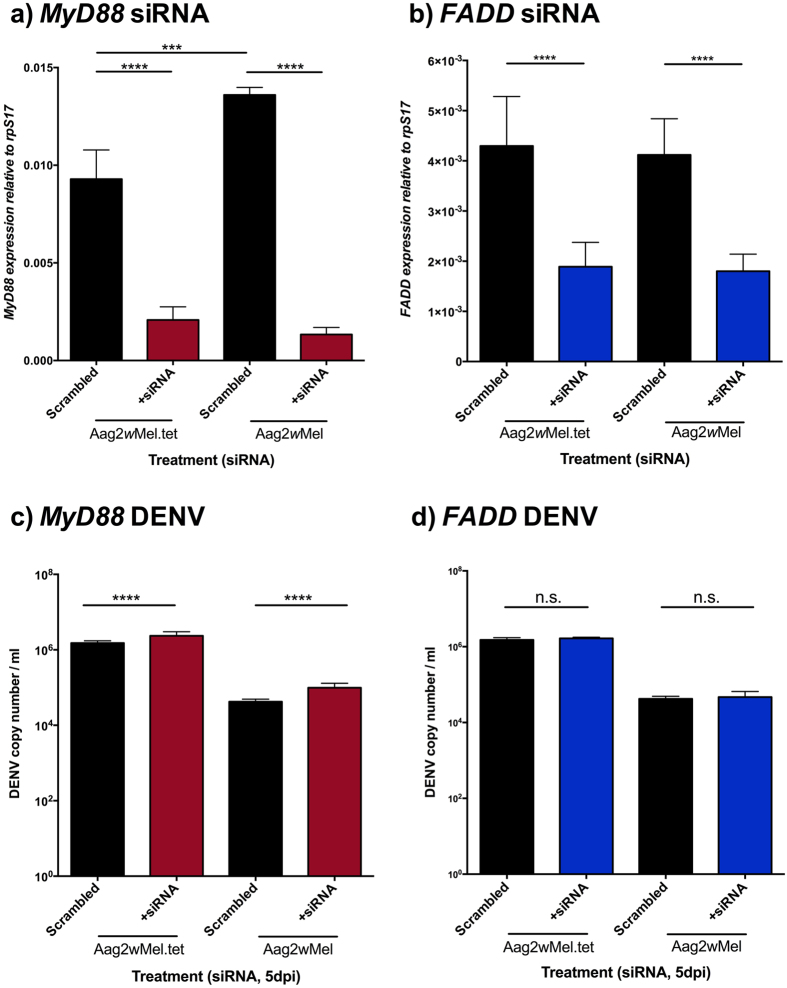
Figure 2. Knockdown of antibacterial pathways.
Cell knockdown in Wolbachia-infected or tetracycline-treated Aag2 for (a) MyD88 (Toll) and (b) FADD (Imd). Gene expression was normalized to A. aegypti housekeeping gene rpS17. Graphs (c,d) correspond to DENV loads after cells were challenged with DENV-2 and collected at 5dpi. All graphs show medians with interquartile ranges (n = 12 per treatment). Black columns depict scrambled controls. Significance is based on post-hoc comparisons following ANOVAs on logarithmic transformed data. ***p < 0.001; ****p < 0.0001.

