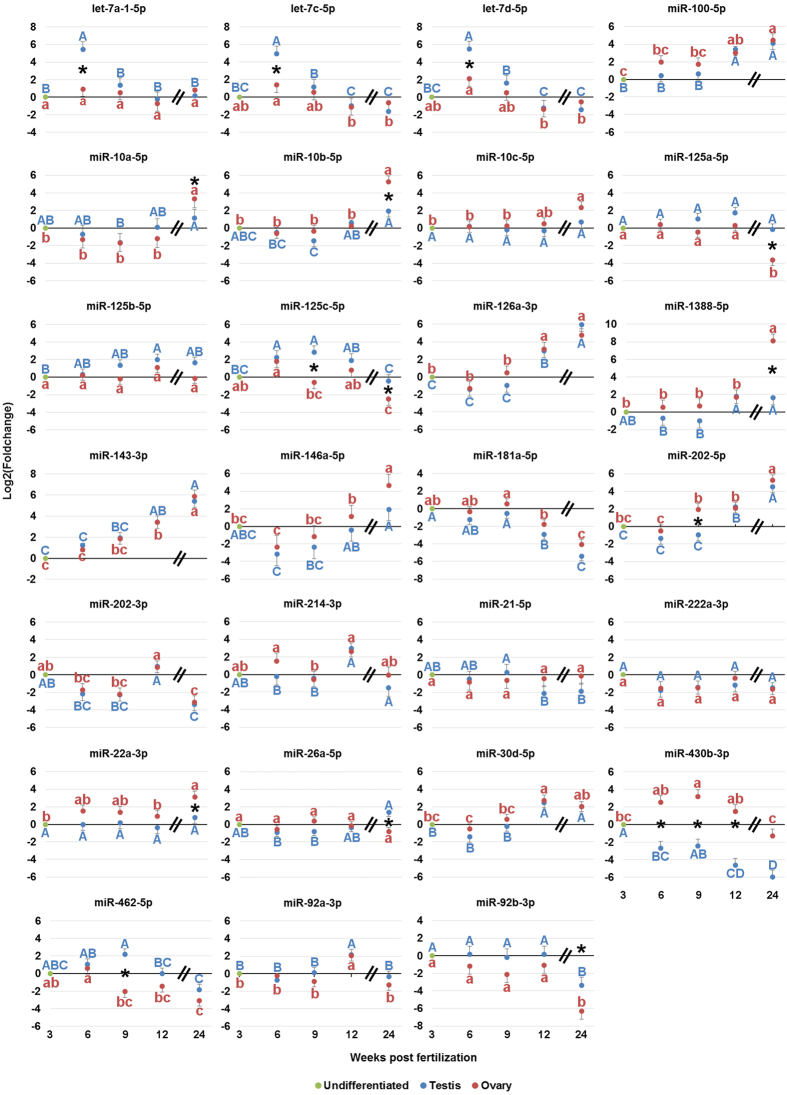
Figure 5. Dynamics of miRNA expression in zebrafish gonads over time.
Each data point represents the average log-transformed fold change for the reads at a given time point (n = 5 for each testis and ovary sampling point) relative to undifferentiated gonads (pooled sample) at 3 weeks post fertilization. Within each sex, values marked with different letters (blue upper case for testis, red lower case for ovary) are significantly different from each other. Reads were normalized using DESeq2 and statistical significance was determined by an adjusted p-value ≤ 0.01 and a log2 fold change ≥ |2|. Significant differences between sexes at a given time point are marked with asterisks. The double break at X-axis highlights the discontinuous sampling interval between 12 and 24 weeks post fertilization. Vertical bars represent standard deviation.

