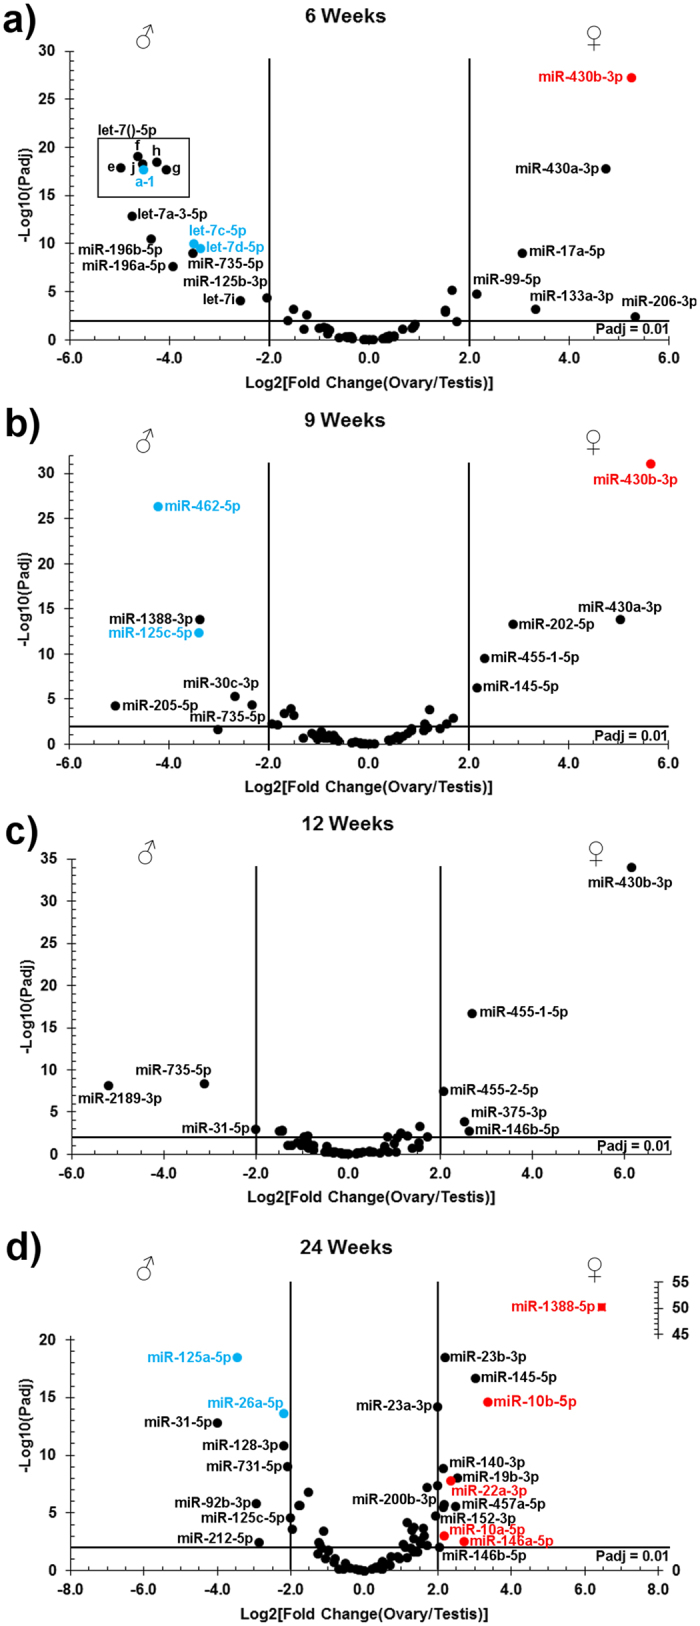
Figure 6. Differences in miRNA abundance between testes and ovaries.

The plots show adjusted p-value (y-axis) against the log2-transformed fold change (ovary/testis) for miRNAs with a normalized read count ≥ 100 at 6 (panel a), 9 (b), 12 (c), and 24 weeks post fertilization (d). Named miRNAs appearing with a log2 fold change value ≥ |2| and an adjusted p-value ≤ 0.01 were considered as differentially expressed. Blue and red labels identify miRNA present among the 10 most abundant miRNA at the given time point for testis and ovary, respectively. The square data point in panel D (miR-1388-5p) is plotted against the secondary y-axis.
