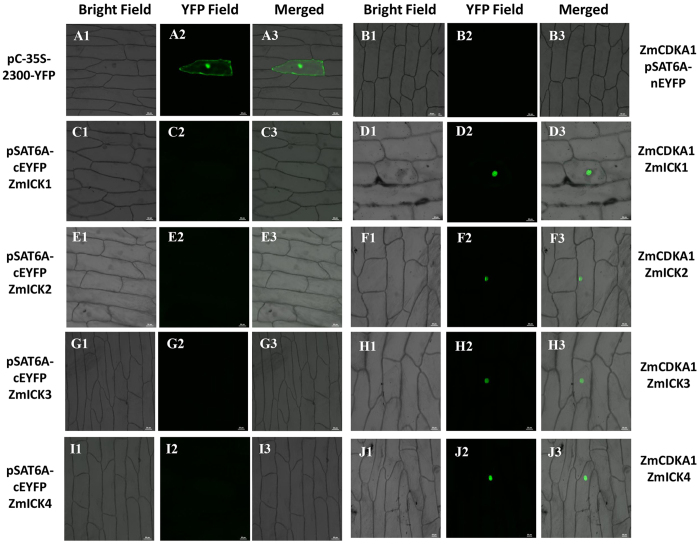
Figure 5. Bimolecular fluorescence complementation analysis of ZmICK1, ZmICK2, ZmICK3, and ZmICK4 with ZmCDKA1, the pCAMBIA2300-eYFP served as a positive control, the pSAT6A-cEYFP and pSAT6-ZmICK-nEYFP, and pSAT6A-ZmCDKA-cEYFP and pSAT6-nEYFP was used as a negative control.
The pSAT6-ZmICK-nEYFP and the corresponding pSAT6-ZmICK-nEYFP and pSAT6A-ZmCDKA1-cEYFP images are shown side-by-side. (A1-J1) are the detection result under bright-field. (A2-J2) present the detection under the YFP field. (A3-J3) are the merged images of bright field and YFP field. Each alphabet labelled 1 to 3 represents the same combination. Bar = 50 μm.

