
Figure 1. Scatter plot showing the Prevotella ratio in our cohort study.
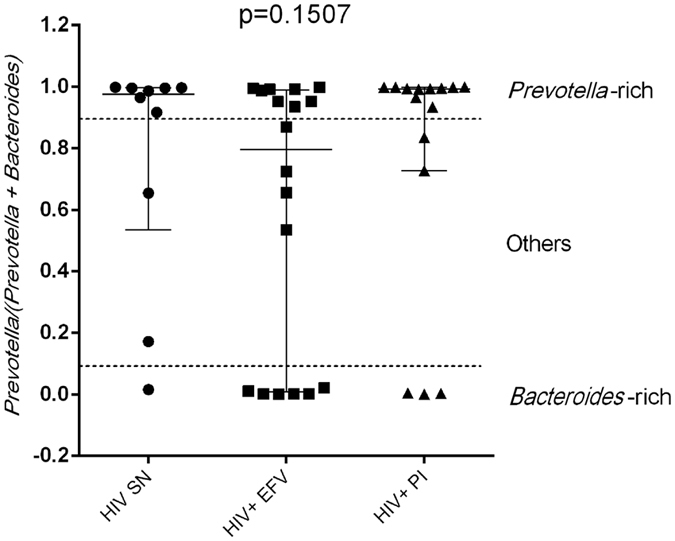
The Prevotella ratio was calculated as follows: the relative abundance of Prevotella was divided by the sum of the relative abundance of Prevotella and of Bacteroides as published in ref. 28. A value > 0.9 being Prevotella-rich and a value <0.1 being Bacteroides rich. Values in between >0.1- < 0.9 were considered as others. Data was plotted as the median with interquartile range. Non-parametric Kruskal-Wallis was used to compare the Prevotella ratio in our study groups using Graph Pad Prism version 6.