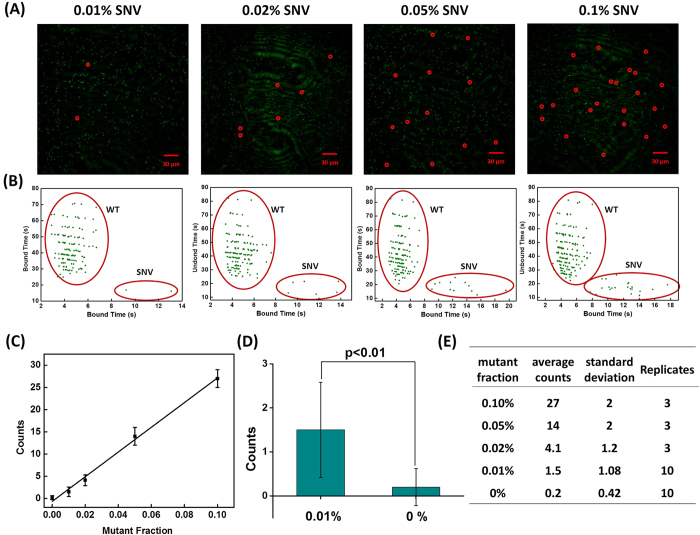
Figure 4.
(A) Time-averaged fluorescence image consisting of fluorescent puncta formed by binding of probes to SNV and WT DNA molecules, as well as non-target background. Individual fluorescent puncta were analyzed for kinetics of probe binding to distinguish between signal from SNV and WT DNA molecules. The SNV molecules are highlighted by red circles. (B) SNV and WT target molecules exhibit distinct clusters classified by k-means clustering of bound time values. The SNV concentration was varied while the total target concentration remained fixed at 10 pM. The optimal assay conditions are as follows: probe concentration of 25 nM, NaCl concentration of 500 mM. (C) Linear relationship between mutant fraction and positive SNV counts. (D) Count numbers for a mutant: wild type frequency of 0.01% is significantly different from a 0% frequency (student t-test, p < 0.01). (E) The mean and standard deviation of SNV counts and number replicates for each mutant: WT frequency tested.

