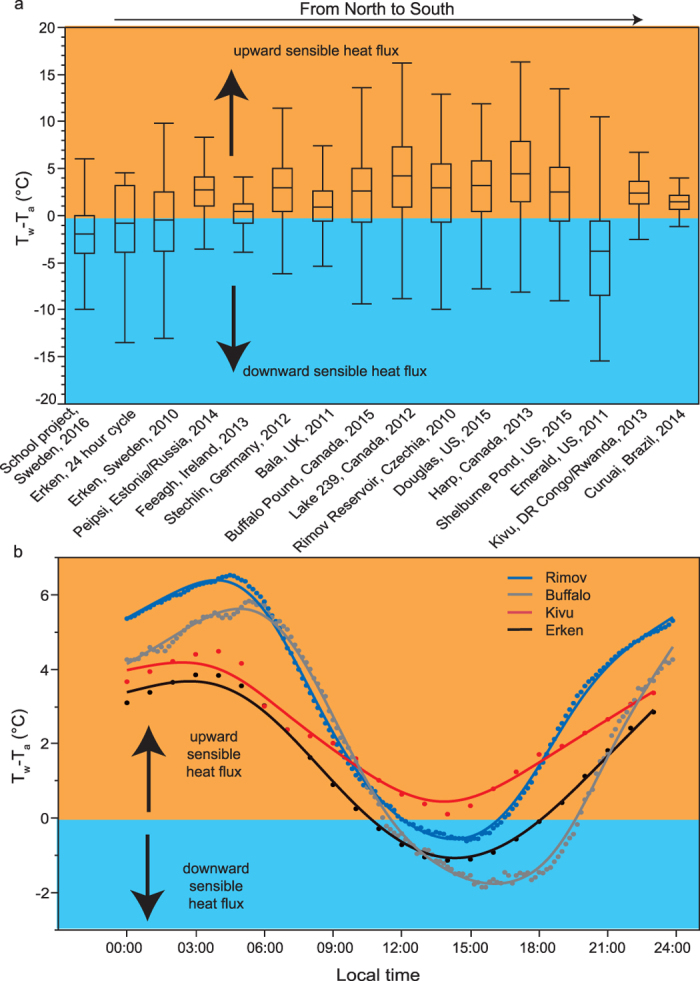
Figure 2. Spatial and temporal variations in the temperature gradient between surface water and the overlying air (Tw-Ta).

Panel a: box plots of Tw-Ta variations across small ponds, lakes, streams/rivers and the shoreline of the Baltic Sea (school project, n = 1355), within 24 hours on September 1, 2014 in the Swedish Lake Erken (n = 24), and within a year during the open water season May to October, based on high-frequency temperature measurements from 14 lakes across the globe (Table 1). Box size corresponds to the interquartile range and whiskers to a distance of 1.5 times the interquartile range from the 25th and 75th quantile, respectively. When more than one year of data was available we chose the time period 2010–2015 and plotted the year with the highest Tw-Ta variance. Panel b: Tw-Ta variations within 24 hours in the most northern and dimictic lake (Erken), a tropical lake (Kivu), a shallow polymictic lake (Buffalo) and a deep small reservoir (Rimov). The Tw-Ta values are median values during May to October from all available years (Table 1). Data points from each lake are connected by a spline function with lambda equal to 0.05. In both panels the orange color indicates when there is an upward sensible heat flux and the blue color when there is a downward sensible heat flux.
