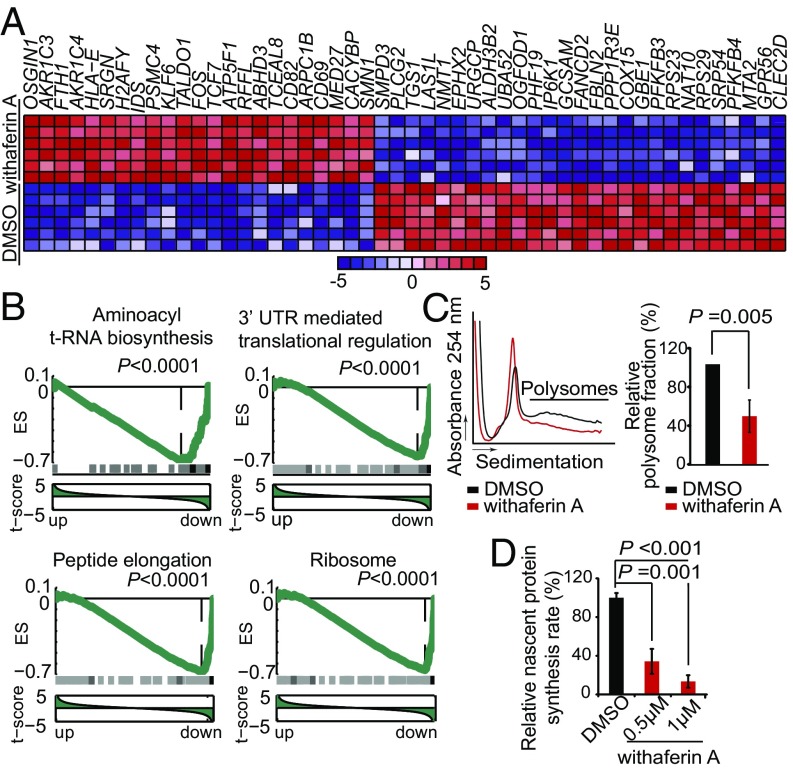
Fig. 5.
Inhibition of protein translation by withaferin A in T-ALL. (A) Heat map representation of top differentially expressed genes in CUTLL1 cells treated with vehicle only and withaferin A (24 h). Up-regulated transcripts are shown in red, and down-regulated transcripts are shown in blue. Bar at bottom indicates differential expression levels in SD units. (B) Representative examples of gene set enrichment plots corresponding to GSEA analysis of MSigDB C2 data sets enriched in the expression signature associated with withaferin A treatment samples compared with vehicle-treated controls. (C) Polysome profiling analysis of JURKAT cells treated with withaferin A or vehicle only (DMSO). (D) Quantitative analysis of nascent protein synthesis measured by ClickIT on JURKAT cells treated with DMSO or withaferin A. Bars in C and D represent mean ± SD.

