Fig. 4.
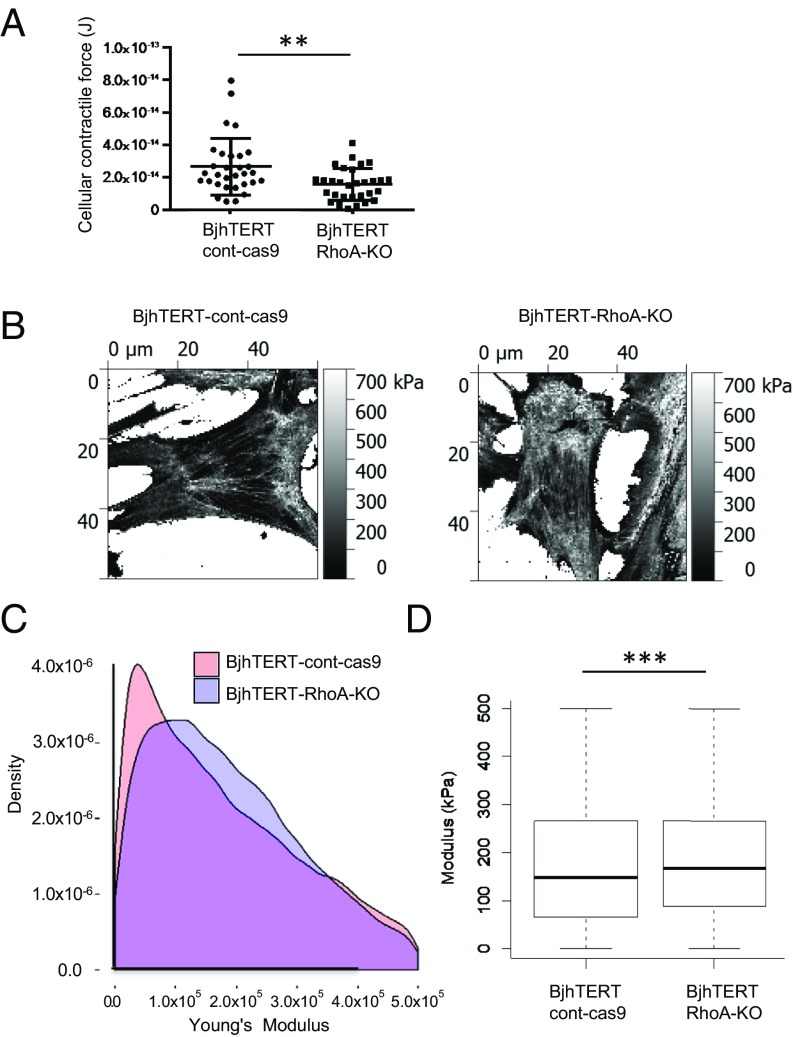
Altered cellular contractile forces and cell stiffness of tumor-stimulatory fibroblasts. (A) Contractile forces of individual control (dots) and RhoA-KO (squares) fibroblasts. The P value indicates a difference of 0.004. **P > 0.01. (B) Image showing the Young's modulus of the locations over the control (Left) and RhoA-KO (Right) fibroblasts. Lighter colors indicate higher modulus. (C) Density plot showing distribution of the measured stiffness for values of individual locations of measurement within the physiological range of 0 kPA to 75 kPa, for 33,505 data points from control fibroblasts, and 33,505 data points from RhoA-KO fibroblasts. (D) Boxplot showing distributions and median values of measured stiffness for values within the physiological range of 0 kPa to 75 kPa, including 33,505 data points for control fibroblasts, and 33,505 data points for RhoA-KO fibroblasts. Data for the RhoA-KO cells show significantly higher stiffness. ***P < 2.2e-16.

